Immigrants from Indonesia vs Turkish 11th Grade
COMPARE
Immigrants from Indonesia
Turkish
11th Grade
11th Grade Comparison
Immigrants from Indonesia
Turks
92.4%
11TH GRADE
33.7/ 100
METRIC RATING
188th/ 347
METRIC RANK
94.0%
11TH GRADE
99.9/ 100
METRIC RATING
51st/ 347
METRIC RANK
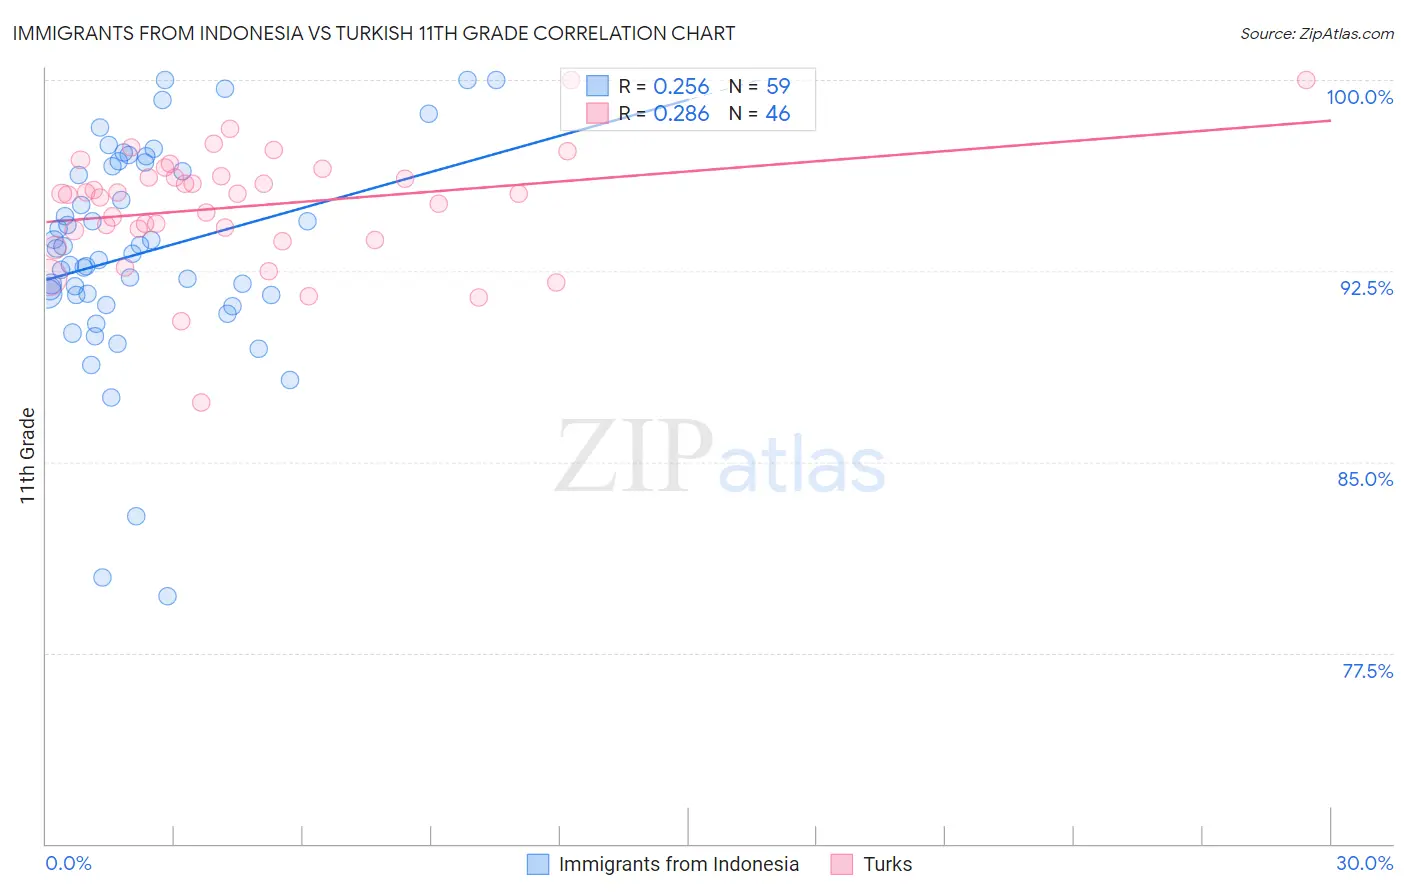
Immigrants from Indonesia vs Turkish 11th Grade Correlation Chart
The statistical analysis conducted on geographies consisting of 215,778,424 people shows a weak positive correlation between the proportion of Immigrants from Indonesia and percentage of population with at least 11th grade education in the United States with a correlation coefficient (R) of 0.256 and weighted average of 92.4%. Similarly, the statistical analysis conducted on geographies consisting of 271,864,104 people shows a weak positive correlation between the proportion of Turks and percentage of population with at least 11th grade education in the United States with a correlation coefficient (R) of 0.286 and weighted average of 94.0%, a difference of 1.8%.
11th Grade Correlation Summary
| Measurement | Immigrants from Indonesia | Turkish |
| Minimum | 79.7% | 87.4% |
| Maximum | 100.0% | 100.0% |
| Range | 20.3% | 12.6% |
| Mean | 93.2% | 95.0% |
| Median | 93.2% | 95.5% |
| Interquartile 25% (IQ1) | 91.5% | 94.1% |
| Interquartile 75% (IQ3) | 96.6% | 96.2% |
| Interquartile Range (IQR) | 5.1% | 2.1% |
| Standard Deviation (Sample) | 4.2% | 2.3% |
| Standard Deviation (Population) | 4.2% | 2.3% |
Similar Demographics by 11th Grade
Demographics Similar to Immigrants from Indonesia by 11th Grade
In terms of 11th grade, the demographic groups most similar to Immigrants from Indonesia are Immigrants from Chile (92.4%, a difference of 0.0%), Immigrants from Western Asia (92.4%, a difference of 0.010%), Arapaho (92.4%, a difference of 0.020%), Immigrants from Nepal (92.4%, a difference of 0.030%), and Chickasaw (92.3%, a difference of 0.030%).
| Demographics | Rating | Rank | 11th Grade |
| Cherokee | 40.7 /100 | #181 | Average 92.4% |
| Immigrants | Morocco | 38.6 /100 | #182 | Fair 92.4% |
| Immigrants | Malaysia | 37.6 /100 | #183 | Fair 92.4% |
| Immigrants | Asia | 37.4 /100 | #184 | Fair 92.4% |
| Immigrants | Nepal | 36.4 /100 | #185 | Fair 92.4% |
| Arapaho | 35.1 /100 | #186 | Fair 92.4% |
| Immigrants | Western Asia | 35.0 /100 | #187 | Fair 92.4% |
| Immigrants | Indonesia | 33.7 /100 | #188 | Fair 92.4% |
| Immigrants | Chile | 33.3 /100 | #189 | Fair 92.4% |
| Chickasaw | 31.4 /100 | #190 | Fair 92.3% |
| French American Indians | 30.8 /100 | #191 | Fair 92.3% |
| Immigrants | Syria | 30.4 /100 | #192 | Fair 92.3% |
| Moroccans | 28.7 /100 | #193 | Fair 92.3% |
| Sioux | 28.5 /100 | #194 | Fair 92.3% |
| Liberians | 26.8 /100 | #195 | Fair 92.3% |
Demographics Similar to Turks by 11th Grade
In terms of 11th grade, the demographic groups most similar to Turks are Immigrants from Canada (94.0%, a difference of 0.010%), Immigrants from Australia (94.0%, a difference of 0.020%), Filipino (94.1%, a difference of 0.030%), Macedonian (94.1%, a difference of 0.030%), and Slavic (94.1%, a difference of 0.030%).
| Demographics | Rating | Rank | 11th Grade |
| Immigrants | Ireland | 99.9 /100 | #44 | Exceptional 94.1% |
| Australians | 99.9 /100 | #45 | Exceptional 94.1% |
| Serbians | 99.9 /100 | #46 | Exceptional 94.1% |
| Filipinos | 99.9 /100 | #47 | Exceptional 94.1% |
| Macedonians | 99.9 /100 | #48 | Exceptional 94.1% |
| Slavs | 99.9 /100 | #49 | Exceptional 94.1% |
| French | 99.9 /100 | #50 | Exceptional 94.1% |
| Turks | 99.9 /100 | #51 | Exceptional 94.0% |
| Immigrants | Canada | 99.9 /100 | #52 | Exceptional 94.0% |
| Immigrants | Australia | 99.9 /100 | #53 | Exceptional 94.0% |
| Immigrants | North America | 99.9 /100 | #54 | Exceptional 94.0% |
| Czechoslovakians | 99.9 /100 | #55 | Exceptional 94.0% |
| French Canadians | 99.9 /100 | #56 | Exceptional 94.0% |
| New Zealanders | 99.9 /100 | #57 | Exceptional 94.0% |
| Iranians | 99.9 /100 | #58 | Exceptional 94.0% |