Immigrants from Moldova vs Navajo Bachelor's Degree
COMPARE
Immigrants from Moldova
Navajo
Bachelor's Degree
Bachelor's Degree Comparison
Immigrants from Moldova
Navajo
41.6%
BACHELOR'S DEGREE
98.4/ 100
METRIC RATING
96th/ 347
METRIC RANK
23.6%
BACHELOR'S DEGREE
0.0/ 100
METRIC RATING
344th/ 347
METRIC RANK
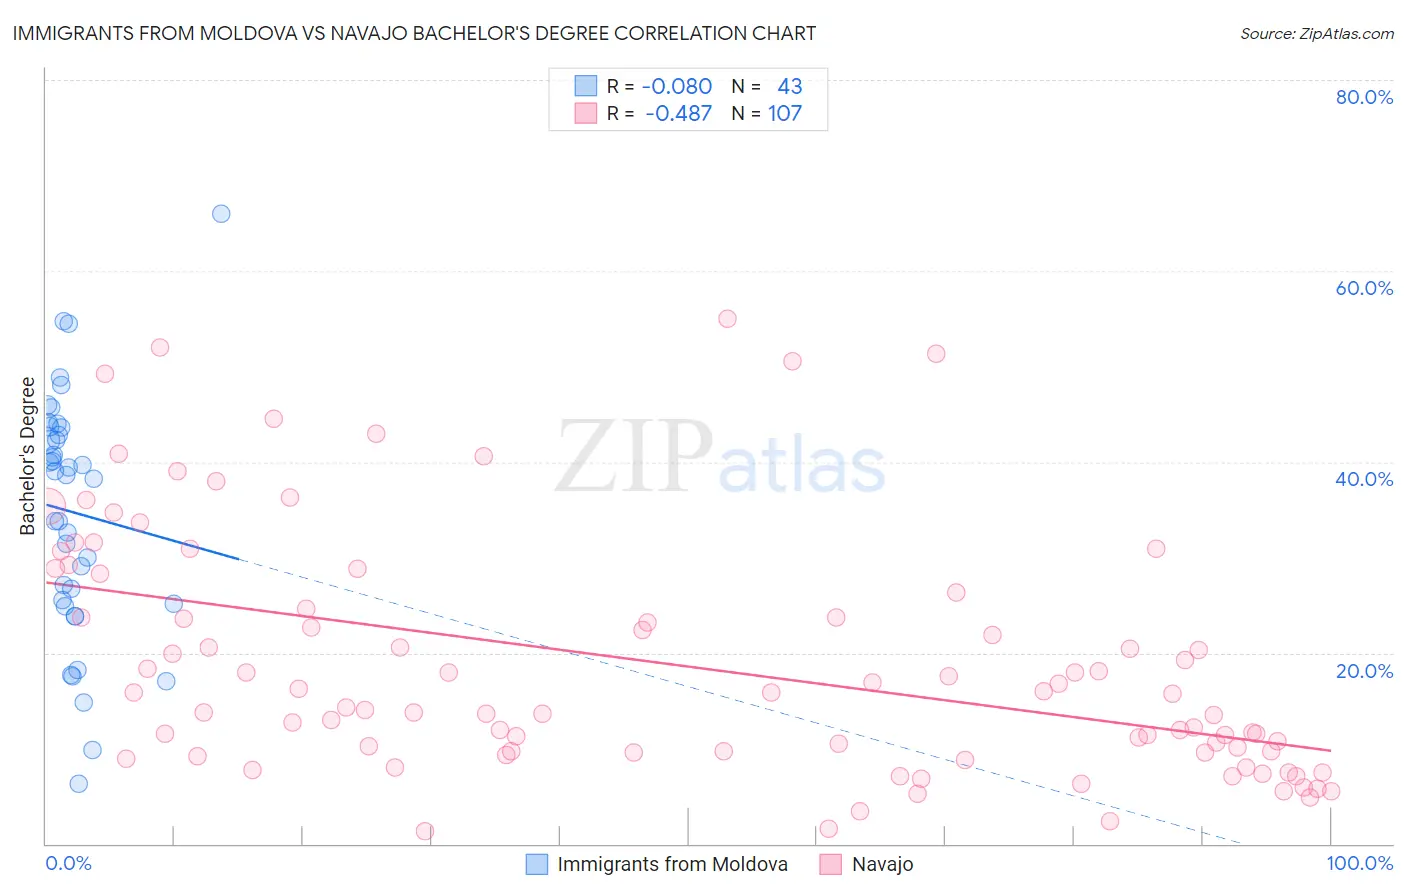
Immigrants from Moldova vs Navajo Bachelor's Degree Correlation Chart
The statistical analysis conducted on geographies consisting of 124,396,308 people shows a slight negative correlation between the proportion of Immigrants from Moldova and percentage of population with at least bachelor's degree education in the United States with a correlation coefficient (R) of -0.080 and weighted average of 41.6%. Similarly, the statistical analysis conducted on geographies consisting of 224,864,569 people shows a moderate negative correlation between the proportion of Navajo and percentage of population with at least bachelor's degree education in the United States with a correlation coefficient (R) of -0.487 and weighted average of 23.6%, a difference of 76.2%.
Bachelor's Degree Correlation Summary
| Measurement | Immigrants from Moldova | Navajo |
| Minimum | 6.3% | 1.3% |
| Maximum | 66.0% | 54.9% |
| Range | 59.6% | 53.6% |
| Mean | 34.7% | 18.7% |
| Median | 38.7% | 14.3% |
| Interquartile 25% (IQ1) | 25.2% | 9.6% |
| Interquartile 75% (IQ3) | 43.6% | 24.7% |
| Interquartile Range (IQR) | 18.4% | 15.1% |
| Standard Deviation (Sample) | 12.7% | 12.6% |
| Standard Deviation (Population) | 12.6% | 12.5% |
Similar Demographics by Bachelor's Degree
Demographics Similar to Immigrants from Moldova by Bachelor's Degree
In terms of bachelor's degree, the demographic groups most similar to Immigrants from Moldova are Romanian (41.6%, a difference of 0.050%), Immigrants from North America (41.7%, a difference of 0.11%), Immigrants from Ukraine (41.5%, a difference of 0.16%), Immigrants from Nepal (41.7%, a difference of 0.23%), and Immigrants from Canada (41.7%, a difference of 0.26%).
| Demographics | Rating | Rank | Bachelor's Degree |
| Greeks | 99.0 /100 | #89 | Exceptional 42.0% |
| Laotians | 98.9 /100 | #90 | Exceptional 42.0% |
| Immigrants | Northern Africa | 98.9 /100 | #91 | Exceptional 41.9% |
| Maltese | 98.8 /100 | #92 | Exceptional 41.9% |
| Immigrants | Canada | 98.6 /100 | #93 | Exceptional 41.7% |
| Immigrants | Nepal | 98.6 /100 | #94 | Exceptional 41.7% |
| Immigrants | North America | 98.5 /100 | #95 | Exceptional 41.7% |
| Immigrants | Moldova | 98.4 /100 | #96 | Exceptional 41.6% |
| Romanians | 98.4 /100 | #97 | Exceptional 41.6% |
| Immigrants | Ukraine | 98.3 /100 | #98 | Exceptional 41.5% |
| Immigrants | England | 98.1 /100 | #99 | Exceptional 41.4% |
| Macedonians | 98.1 /100 | #100 | Exceptional 41.4% |
| Immigrants | Morocco | 98.0 /100 | #101 | Exceptional 41.4% |
| Immigrants | Italy | 97.8 /100 | #102 | Exceptional 41.3% |
| Chileans | 97.5 /100 | #103 | Exceptional 41.2% |
Demographics Similar to Navajo by Bachelor's Degree
In terms of bachelor's degree, the demographic groups most similar to Navajo are Pima (23.2%, a difference of 1.8%), Tohono O'odham (24.4%, a difference of 3.4%), Yakama (24.5%, a difference of 3.6%), Yuman (24.5%, a difference of 3.9%), and Lumbee (24.8%, a difference of 4.8%).
| Demographics | Rating | Rank | Bachelor's Degree |
| Mexicans | 0.0 /100 | #333 | Tragic 27.1% |
| Arapaho | 0.0 /100 | #334 | Tragic 26.6% |
| Natives/Alaskans | 0.0 /100 | #335 | Tragic 26.3% |
| Immigrants | Mexico | 0.0 /100 | #336 | Tragic 26.1% |
| Inupiat | 0.0 /100 | #337 | Tragic 25.8% |
| Pueblo | 0.0 /100 | #338 | Tragic 25.5% |
| Hopi | 0.0 /100 | #339 | Tragic 25.3% |
| Lumbee | 0.0 /100 | #340 | Tragic 24.8% |
| Yuman | 0.0 /100 | #341 | Tragic 24.5% |
| Yakama | 0.0 /100 | #342 | Tragic 24.5% |
| Tohono O'odham | 0.0 /100 | #343 | Tragic 24.4% |
| Navajo | 0.0 /100 | #344 | Tragic 23.6% |
| Pima | 0.0 /100 | #345 | Tragic 23.2% |
| Houma | 0.0 /100 | #346 | Tragic 21.4% |
| Yup'ik | 0.0 /100 | #347 | Tragic 19.4% |