Mexican vs West Indian 8th Grade
COMPARE
Mexican
West Indian
8th Grade
8th Grade Comparison
Mexicans
West Indians
91.4%
8TH GRADE
0.0/ 100
METRIC RATING
339th/ 347
METRIC RANK
94.8%
8TH GRADE
0.3/ 100
METRIC RATING
266th/ 347
METRIC RANK
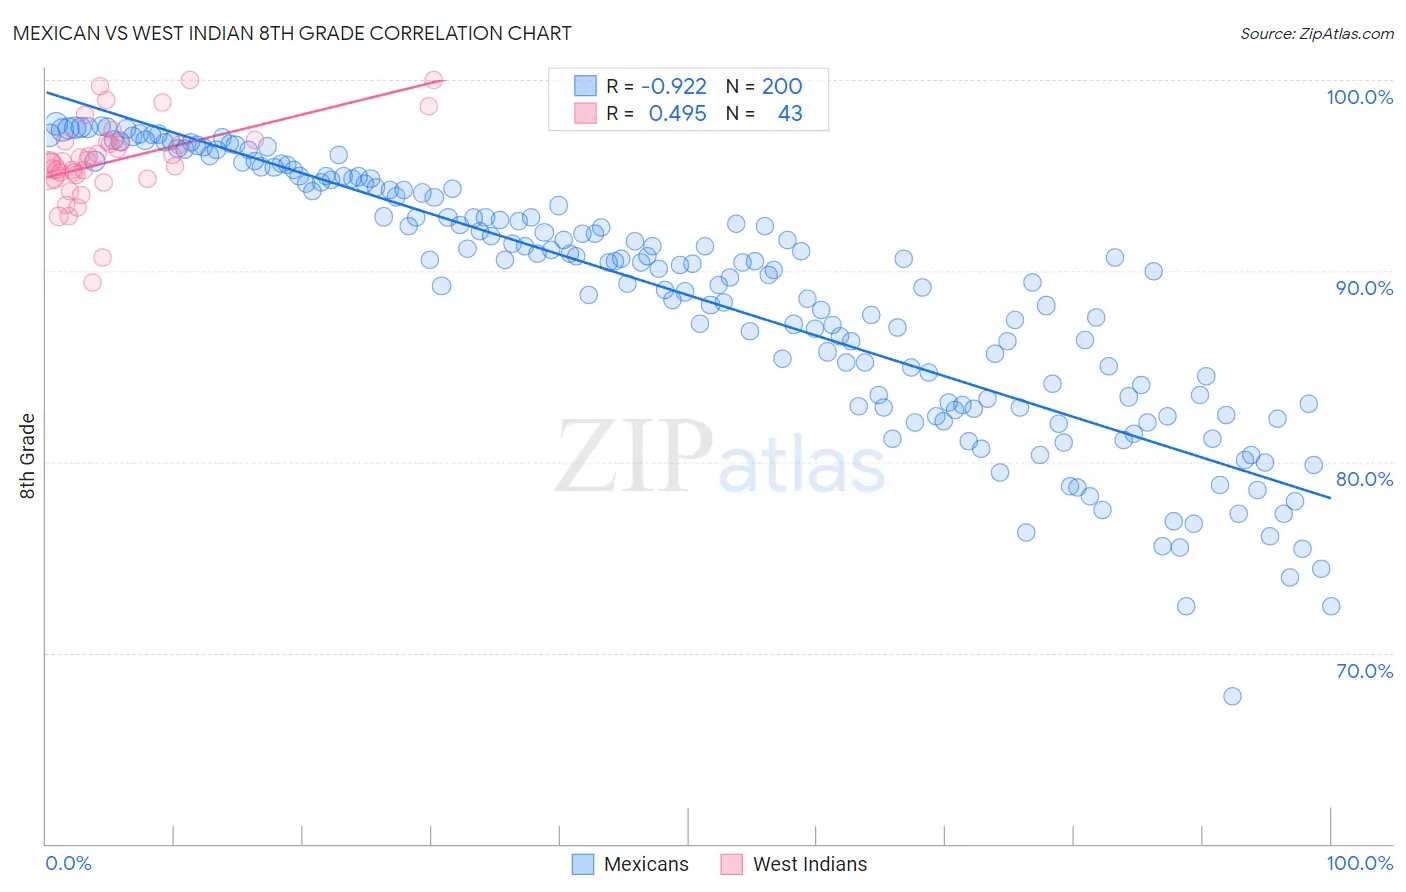
Mexican vs West Indian 8th Grade Correlation Chart
The statistical analysis conducted on geographies consisting of 565,339,555 people shows a near-perfect negative correlation between the proportion of Mexicans and percentage of population with at least 8th grade education in the United States with a correlation coefficient (R) of -0.922 and weighted average of 91.4%. Similarly, the statistical analysis conducted on geographies consisting of 254,059,006 people shows a moderate positive correlation between the proportion of West Indians and percentage of population with at least 8th grade education in the United States with a correlation coefficient (R) of 0.495 and weighted average of 94.8%, a difference of 3.8%.
8th Grade Correlation Summary
| Measurement | Mexican | West Indian |
| Minimum | 67.7% | 89.4% |
| Maximum | 97.7% | 100.0% |
| Range | 29.9% | 10.6% |
| Mean | 88.7% | 95.8% |
| Median | 90.4% | 95.7% |
| Interquartile 25% (IQ1) | 83.2% | 94.9% |
| Interquartile 75% (IQ3) | 94.5% | 96.8% |
| Interquartile Range (IQR) | 11.3% | 1.9% |
| Standard Deviation (Sample) | 6.7% | 2.2% |
| Standard Deviation (Population) | 6.7% | 2.2% |
Similar Demographics by 8th Grade
Demographics Similar to Mexicans by 8th Grade
In terms of 8th grade, the demographic groups most similar to Mexicans are Yakama (91.2%, a difference of 0.13%), Central American (91.6%, a difference of 0.23%), Guatemalan (91.1%, a difference of 0.24%), Immigrants from Latin America (91.7%, a difference of 0.37%), and Salvadoran (90.9%, a difference of 0.53%).
| Demographics | Rating | Rank | 8th Grade |
| Immigrants | Dominican Republic | 0.0 /100 | #332 | Tragic 92.3% |
| Hispanics or Latinos | 0.0 /100 | #333 | Tragic 92.2% |
| Immigrants | Yemen | 0.0 /100 | #334 | Tragic 92.1% |
| Mexican American Indians | 0.0 /100 | #335 | Tragic 92.1% |
| Immigrants | Honduras | 0.0 /100 | #336 | Tragic 91.9% |
| Immigrants | Latin America | 0.0 /100 | #337 | Tragic 91.7% |
| Central Americans | 0.0 /100 | #338 | Tragic 91.6% |
| Mexicans | 0.0 /100 | #339 | Tragic 91.4% |
| Yakama | 0.0 /100 | #340 | Tragic 91.2% |
| Guatemalans | 0.0 /100 | #341 | Tragic 91.1% |
| Salvadorans | 0.0 /100 | #342 | Tragic 90.9% |
| Immigrants | Guatemala | 0.0 /100 | #343 | Tragic 90.7% |
| Immigrants | Central America | 0.0 /100 | #344 | Tragic 90.4% |
| Immigrants | El Salvador | 0.0 /100 | #345 | Tragic 90.3% |
| Immigrants | Mexico | 0.0 /100 | #346 | Tragic 90.2% |
Demographics Similar to West Indians by 8th Grade
In terms of 8th grade, the demographic groups most similar to West Indians are Immigrants from Ghana (94.8%, a difference of 0.010%), Immigrants from Uruguay (94.8%, a difference of 0.020%), Yuman (94.9%, a difference of 0.040%), Immigrants from Thailand (94.8%, a difference of 0.040%), and Immigrants from Hong Kong (94.9%, a difference of 0.050%).
| Demographics | Rating | Rank | 8th Grade |
| Ghanaians | 0.6 /100 | #259 | Tragic 94.9% |
| Immigrants | Jamaica | 0.6 /100 | #260 | Tragic 94.9% |
| Immigrants | Costa Rica | 0.5 /100 | #261 | Tragic 94.9% |
| Immigrants | Nigeria | 0.4 /100 | #262 | Tragic 94.9% |
| Immigrants | Hong Kong | 0.4 /100 | #263 | Tragic 94.9% |
| South Americans | 0.4 /100 | #264 | Tragic 94.9% |
| Yuman | 0.4 /100 | #265 | Tragic 94.9% |
| West Indians | 0.3 /100 | #266 | Tragic 94.8% |
| Immigrants | Ghana | 0.3 /100 | #267 | Tragic 94.8% |
| Immigrants | Uruguay | 0.3 /100 | #268 | Tragic 94.8% |
| Immigrants | Thailand | 0.2 /100 | #269 | Tragic 94.8% |
| Immigrants | Uzbekistan | 0.2 /100 | #270 | Tragic 94.8% |
| Immigrants | Afghanistan | 0.2 /100 | #271 | Tragic 94.8% |
| Immigrants | South America | 0.2 /100 | #272 | Tragic 94.8% |
| Immigrants | Western Africa | 0.2 /100 | #273 | Tragic 94.8% |