Mexican American Indian vs Immigrants from Kuwait 5th Grade
COMPARE
Mexican American Indian
Immigrants from Kuwait
5th Grade
5th Grade Comparison
Mexican American Indians
Immigrants from Kuwait
95.5%
5TH GRADE
0.0/ 100
METRIC RATING
329th/ 347
METRIC RANK
97.6%
5TH GRADE
90.4/ 100
METRIC RATING
132nd/ 347
METRIC RANK
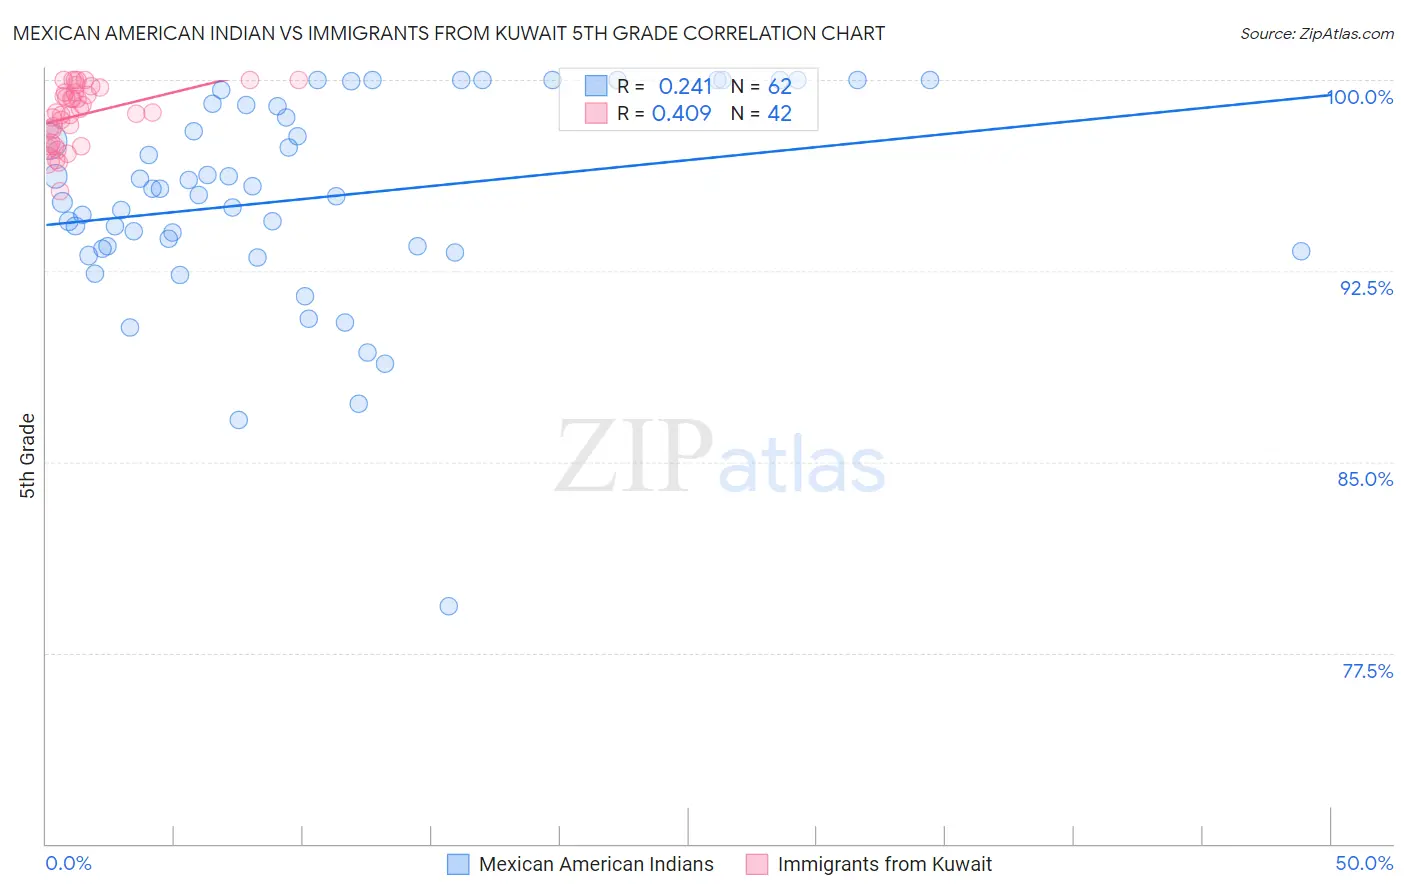
Mexican American Indian vs Immigrants from Kuwait 5th Grade Correlation Chart
The statistical analysis conducted on geographies consisting of 317,621,104 people shows a weak positive correlation between the proportion of Mexican American Indians and percentage of population with at least 5th grade education in the United States with a correlation coefficient (R) of 0.241 and weighted average of 95.5%. Similarly, the statistical analysis conducted on geographies consisting of 136,913,666 people shows a moderate positive correlation between the proportion of Immigrants from Kuwait and percentage of population with at least 5th grade education in the United States with a correlation coefficient (R) of 0.409 and weighted average of 97.6%, a difference of 2.1%.
5th Grade Correlation Summary
| Measurement | Mexican American Indian | Immigrants from Kuwait |
| Minimum | 79.3% | 95.6% |
| Maximum | 100.0% | 100.0% |
| Range | 20.7% | 4.4% |
| Mean | 95.4% | 98.6% |
| Median | 95.6% | 98.7% |
| Interquartile 25% (IQ1) | 93.4% | 97.5% |
| Interquartile 75% (IQ3) | 99.0% | 99.5% |
| Interquartile Range (IQR) | 5.6% | 2.0% |
| Standard Deviation (Sample) | 4.1% | 1.1% |
| Standard Deviation (Population) | 4.0% | 1.1% |
Similar Demographics by 5th Grade
Demographics Similar to Mexican American Indians by 5th Grade
In terms of 5th grade, the demographic groups most similar to Mexican American Indians are Cape Verdean (95.5%, a difference of 0.010%), Immigrants from Cambodia (95.5%, a difference of 0.040%), Dominican (95.5%, a difference of 0.040%), Honduran (95.6%, a difference of 0.070%), and Hispanic or Latino (95.6%, a difference of 0.070%).
| Demographics | Rating | Rank | 5th Grade |
| Immigrants | Nicaragua | 0.0 /100 | #322 | Tragic 95.6% |
| Immigrants | Fiji | 0.0 /100 | #323 | Tragic 95.6% |
| Hondurans | 0.0 /100 | #324 | Tragic 95.6% |
| Hispanics or Latinos | 0.0 /100 | #325 | Tragic 95.6% |
| Immigrants | Cambodia | 0.0 /100 | #326 | Tragic 95.5% |
| Dominicans | 0.0 /100 | #327 | Tragic 95.5% |
| Cape Verdeans | 0.0 /100 | #328 | Tragic 95.5% |
| Mexican American Indians | 0.0 /100 | #329 | Tragic 95.5% |
| Immigrants | Armenia | 0.0 /100 | #330 | Tragic 95.4% |
| Immigrants | Honduras | 0.0 /100 | #331 | Tragic 95.4% |
| Immigrants | Dominican Republic | 0.0 /100 | #332 | Tragic 95.3% |
| Immigrants | Latin America | 0.0 /100 | #333 | Tragic 95.3% |
| Nepalese | 0.0 /100 | #334 | Tragic 95.2% |
| Mexicans | 0.0 /100 | #335 | Tragic 95.2% |
| Immigrants | Azores | 0.0 /100 | #336 | Tragic 95.1% |
Demographics Similar to Immigrants from Kuwait by 5th Grade
In terms of 5th grade, the demographic groups most similar to Immigrants from Kuwait are Cambodian (97.6%, a difference of 0.0%), Immigrants from Hungary (97.6%, a difference of 0.0%), Pima (97.6%, a difference of 0.010%), Palestinian (97.5%, a difference of 0.010%), and Immigrants from Serbia (97.6%, a difference of 0.020%).
| Demographics | Rating | Rank | 5th Grade |
| Immigrants | Bulgaria | 93.1 /100 | #125 | Exceptional 97.6% |
| Hmong | 92.3 /100 | #126 | Exceptional 97.6% |
| Immigrants | Serbia | 92.3 /100 | #127 | Exceptional 97.6% |
| Colville | 92.0 /100 | #128 | Exceptional 97.6% |
| Immigrants | Europe | 91.9 /100 | #129 | Exceptional 97.6% |
| Immigrants | Romania | 91.6 /100 | #130 | Exceptional 97.6% |
| Pima | 91.2 /100 | #131 | Exceptional 97.6% |
| Immigrants | Kuwait | 90.4 /100 | #132 | Exceptional 97.6% |
| Cambodians | 90.2 /100 | #133 | Exceptional 97.6% |
| Immigrants | Hungary | 90.1 /100 | #134 | Exceptional 97.6% |
| Palestinians | 89.3 /100 | #135 | Excellent 97.5% |
| Immigrants | Moldova | 87.5 /100 | #136 | Excellent 97.5% |
| Filipinos | 86.8 /100 | #137 | Excellent 97.5% |
| Blackfeet | 86.8 /100 | #138 | Excellent 97.5% |
| Immigrants | Turkey | 86.7 /100 | #139 | Excellent 97.5% |