Immigrants from Dominican Republic vs Immigrants from Kuwait 5th Grade
COMPARE
Immigrants from Dominican Republic
Immigrants from Kuwait
5th Grade
5th Grade Comparison
Immigrants from Dominican Republic
Immigrants from Kuwait
95.3%
5TH GRADE
0.0/ 100
METRIC RATING
332nd/ 347
METRIC RANK
97.6%
5TH GRADE
90.4/ 100
METRIC RATING
132nd/ 347
METRIC RANK
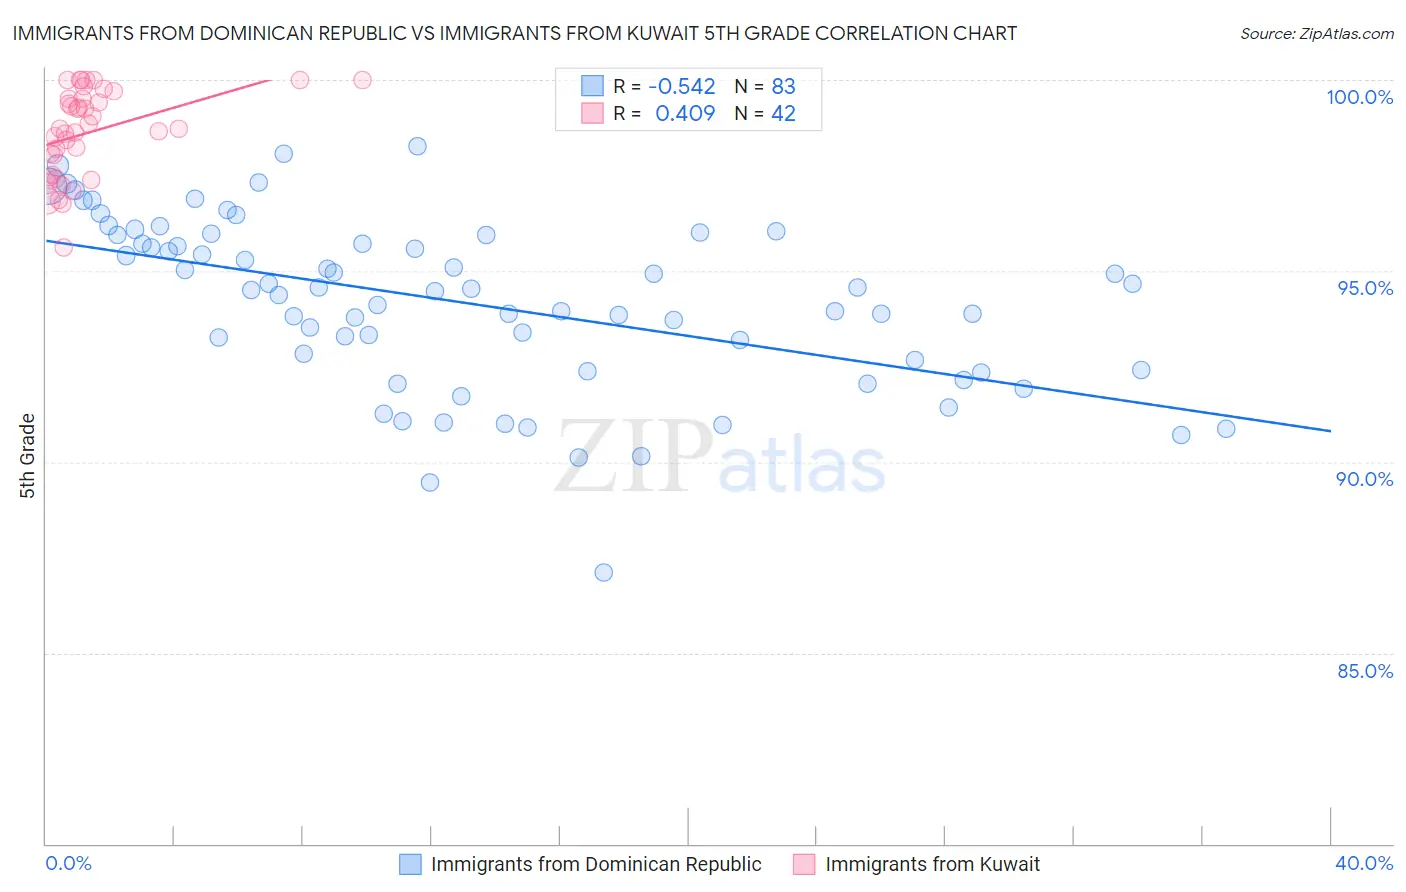
Immigrants from Dominican Republic vs Immigrants from Kuwait 5th Grade Correlation Chart
The statistical analysis conducted on geographies consisting of 275,144,349 people shows a substantial negative correlation between the proportion of Immigrants from Dominican Republic and percentage of population with at least 5th grade education in the United States with a correlation coefficient (R) of -0.542 and weighted average of 95.3%. Similarly, the statistical analysis conducted on geographies consisting of 136,913,666 people shows a moderate positive correlation between the proportion of Immigrants from Kuwait and percentage of population with at least 5th grade education in the United States with a correlation coefficient (R) of 0.409 and weighted average of 97.6%, a difference of 2.4%.
5th Grade Correlation Summary
| Measurement | Immigrants from Dominican Republic | Immigrants from Kuwait |
| Minimum | 87.1% | 95.6% |
| Maximum | 98.3% | 100.0% |
| Range | 11.2% | 4.4% |
| Mean | 94.2% | 98.6% |
| Median | 94.5% | 98.7% |
| Interquartile 25% (IQ1) | 92.4% | 97.5% |
| Interquartile 75% (IQ3) | 95.9% | 99.5% |
| Interquartile Range (IQR) | 3.5% | 2.0% |
| Standard Deviation (Sample) | 2.2% | 1.1% |
| Standard Deviation (Population) | 2.2% | 1.1% |
Similar Demographics by 5th Grade
Demographics Similar to Immigrants from Dominican Republic by 5th Grade
In terms of 5th grade, the demographic groups most similar to Immigrants from Dominican Republic are Immigrants from Latin America (95.3%, a difference of 0.0%), Nepalese (95.2%, a difference of 0.030%), Mexican (95.2%, a difference of 0.060%), Immigrants from Honduras (95.4%, a difference of 0.10%), and Immigrants from Armenia (95.4%, a difference of 0.15%).
| Demographics | Rating | Rank | 5th Grade |
| Hispanics or Latinos | 0.0 /100 | #325 | Tragic 95.6% |
| Immigrants | Cambodia | 0.0 /100 | #326 | Tragic 95.5% |
| Dominicans | 0.0 /100 | #327 | Tragic 95.5% |
| Cape Verdeans | 0.0 /100 | #328 | Tragic 95.5% |
| Mexican American Indians | 0.0 /100 | #329 | Tragic 95.5% |
| Immigrants | Armenia | 0.0 /100 | #330 | Tragic 95.4% |
| Immigrants | Honduras | 0.0 /100 | #331 | Tragic 95.4% |
| Immigrants | Dominican Republic | 0.0 /100 | #332 | Tragic 95.3% |
| Immigrants | Latin America | 0.0 /100 | #333 | Tragic 95.3% |
| Nepalese | 0.0 /100 | #334 | Tragic 95.2% |
| Mexicans | 0.0 /100 | #335 | Tragic 95.2% |
| Immigrants | Azores | 0.0 /100 | #336 | Tragic 95.1% |
| Central Americans | 0.0 /100 | #337 | Tragic 95.1% |
| Immigrants | Cabo Verde | 0.0 /100 | #338 | Tragic 94.9% |
| Immigrants | Yemen | 0.0 /100 | #339 | Tragic 94.9% |
Demographics Similar to Immigrants from Kuwait by 5th Grade
In terms of 5th grade, the demographic groups most similar to Immigrants from Kuwait are Cambodian (97.6%, a difference of 0.0%), Immigrants from Hungary (97.6%, a difference of 0.0%), Pima (97.6%, a difference of 0.010%), Palestinian (97.5%, a difference of 0.010%), and Immigrants from Serbia (97.6%, a difference of 0.020%).
| Demographics | Rating | Rank | 5th Grade |
| Immigrants | Bulgaria | 93.1 /100 | #125 | Exceptional 97.6% |
| Hmong | 92.3 /100 | #126 | Exceptional 97.6% |
| Immigrants | Serbia | 92.3 /100 | #127 | Exceptional 97.6% |
| Colville | 92.0 /100 | #128 | Exceptional 97.6% |
| Immigrants | Europe | 91.9 /100 | #129 | Exceptional 97.6% |
| Immigrants | Romania | 91.6 /100 | #130 | Exceptional 97.6% |
| Pima | 91.2 /100 | #131 | Exceptional 97.6% |
| Immigrants | Kuwait | 90.4 /100 | #132 | Exceptional 97.6% |
| Cambodians | 90.2 /100 | #133 | Exceptional 97.6% |
| Immigrants | Hungary | 90.1 /100 | #134 | Exceptional 97.6% |
| Palestinians | 89.3 /100 | #135 | Excellent 97.5% |
| Immigrants | Moldova | 87.5 /100 | #136 | Excellent 97.5% |
| Filipinos | 86.8 /100 | #137 | Excellent 97.5% |
| Blackfeet | 86.8 /100 | #138 | Excellent 97.5% |
| Immigrants | Turkey | 86.7 /100 | #139 | Excellent 97.5% |