Mexican vs Liberian 9th Grade
COMPARE
Mexican
Liberian
9th Grade
9th Grade Comparison
Mexicans
Liberians
90.0%
9TH GRADE
0.0/ 100
METRIC RATING
340th/ 347
METRIC RANK
94.8%
9TH GRADE
37.4/ 100
METRIC RATING
185th/ 347
METRIC RANK
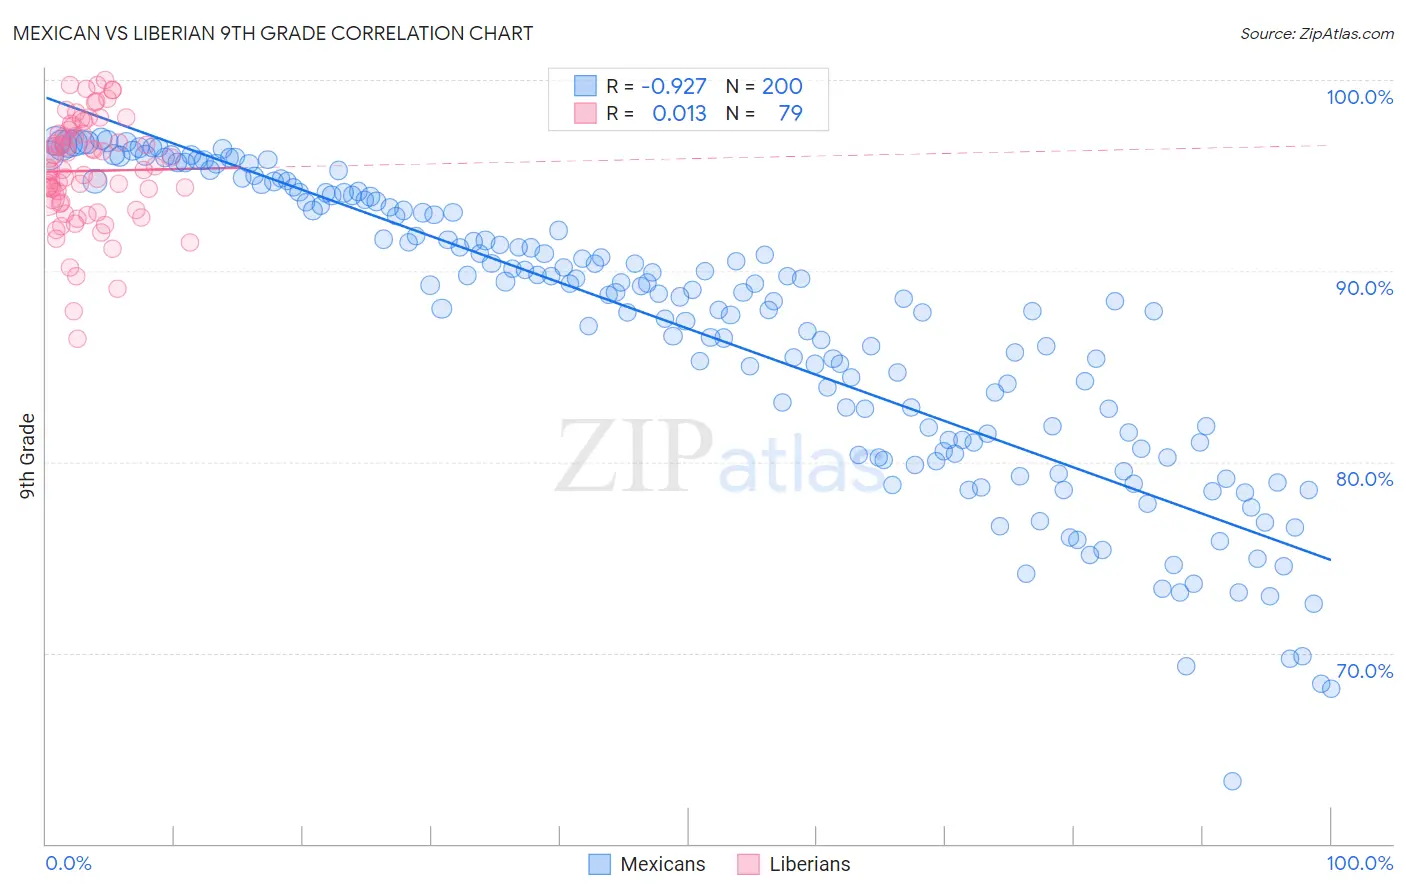
Mexican vs Liberian 9th Grade Correlation Chart
The statistical analysis conducted on geographies consisting of 565,339,264 people shows a near-perfect negative correlation between the proportion of Mexicans and percentage of population with at least 9th grade education in the United States with a correlation coefficient (R) of -0.927 and weighted average of 90.0%. Similarly, the statistical analysis conducted on geographies consisting of 118,101,800 people shows no correlation between the proportion of Liberians and percentage of population with at least 9th grade education in the United States with a correlation coefficient (R) of 0.013 and weighted average of 94.8%, a difference of 5.3%.
9th Grade Correlation Summary
| Measurement | Mexican | Liberian |
| Minimum | 63.2% | 86.4% |
| Maximum | 96.9% | 100.0% |
| Range | 33.7% | 13.6% |
| Mean | 87.0% | 95.2% |
| Median | 88.8% | 95.3% |
| Interquartile 25% (IQ1) | 81.0% | 93.5% |
| Interquartile 75% (IQ3) | 93.5% | 97.2% |
| Interquartile Range (IQR) | 12.5% | 3.7% |
| Standard Deviation (Sample) | 7.6% | 2.8% |
| Standard Deviation (Population) | 7.5% | 2.8% |
Similar Demographics by 9th Grade
Demographics Similar to Mexicans by 9th Grade
In terms of 9th grade, the demographic groups most similar to Mexicans are Yakama (90.1%, a difference of 0.060%), Guatemalan (89.9%, a difference of 0.13%), Central American (90.4%, a difference of 0.40%), Immigrants from Latin America (90.4%, a difference of 0.41%), and Salvadoran (89.6%, a difference of 0.43%).
| Demographics | Rating | Rank | 9th Grade |
| Immigrants | Yemen | 0.0 /100 | #333 | Tragic 90.8% |
| Immigrants | Azores | 0.0 /100 | #334 | Tragic 90.8% |
| Immigrants | Honduras | 0.0 /100 | #335 | Tragic 90.6% |
| Immigrants | Dominican Republic | 0.0 /100 | #336 | Tragic 90.5% |
| Immigrants | Latin America | 0.0 /100 | #337 | Tragic 90.4% |
| Central Americans | 0.0 /100 | #338 | Tragic 90.4% |
| Yakama | 0.0 /100 | #339 | Tragic 90.1% |
| Mexicans | 0.0 /100 | #340 | Tragic 90.0% |
| Guatemalans | 0.0 /100 | #341 | Tragic 89.9% |
| Salvadorans | 0.0 /100 | #342 | Tragic 89.6% |
| Immigrants | Guatemala | 0.0 /100 | #343 | Tragic 89.4% |
| Immigrants | El Salvador | 0.0 /100 | #344 | Tragic 89.0% |
| Immigrants | Central America | 0.0 /100 | #345 | Tragic 89.0% |
| Immigrants | Mexico | 0.0 /100 | #346 | Tragic 88.7% |
| Spanish American Indians | 0.0 /100 | #347 | Tragic 88.3% |
Demographics Similar to Liberians by 9th Grade
In terms of 9th grade, the demographic groups most similar to Liberians are Argentinean (94.8%, a difference of 0.0%), Hopi (94.8%, a difference of 0.0%), Immigrants from Nepal (94.8%, a difference of 0.020%), Guamanian/Chamorro (94.8%, a difference of 0.020%), and Immigrants from Albania (94.8%, a difference of 0.020%).
| Demographics | Rating | Rank | 9th Grade |
| Immigrants | Poland | 46.7 /100 | #178 | Average 94.9% |
| Immigrants | Venezuela | 46.5 /100 | #179 | Average 94.9% |
| Immigrants | Uganda | 43.1 /100 | #180 | Average 94.8% |
| Sierra Leoneans | 42.7 /100 | #181 | Average 94.8% |
| Seminole | 42.5 /100 | #182 | Average 94.8% |
| Immigrants | Nepal | 39.7 /100 | #183 | Fair 94.8% |
| Argentineans | 37.6 /100 | #184 | Fair 94.8% |
| Liberians | 37.4 /100 | #185 | Fair 94.8% |
| Hopi | 37.1 /100 | #186 | Fair 94.8% |
| Guamanians/Chamorros | 35.5 /100 | #187 | Fair 94.8% |
| Immigrants | Albania | 34.5 /100 | #188 | Fair 94.8% |
| Immigrants | Argentina | 34.4 /100 | #189 | Fair 94.8% |
| Sudanese | 32.7 /100 | #190 | Fair 94.7% |
| Assyrians/Chaldeans/Syriacs | 32.0 /100 | #191 | Fair 94.7% |
| Immigrants | Northern Africa | 30.7 /100 | #192 | Fair 94.7% |