Immigrants from Austria vs Vietnamese Master's Degree
COMPARE
Immigrants from Austria
Vietnamese
Master's Degree
Master's Degree Comparison
Immigrants from Austria
Vietnamese
18.8%
MASTER'S DEGREE
100.0/ 100
METRIC RATING
47th/ 347
METRIC RANK
15.8%
MASTER'S DEGREE
85.5/ 100
METRIC RATING
140th/ 347
METRIC RANK
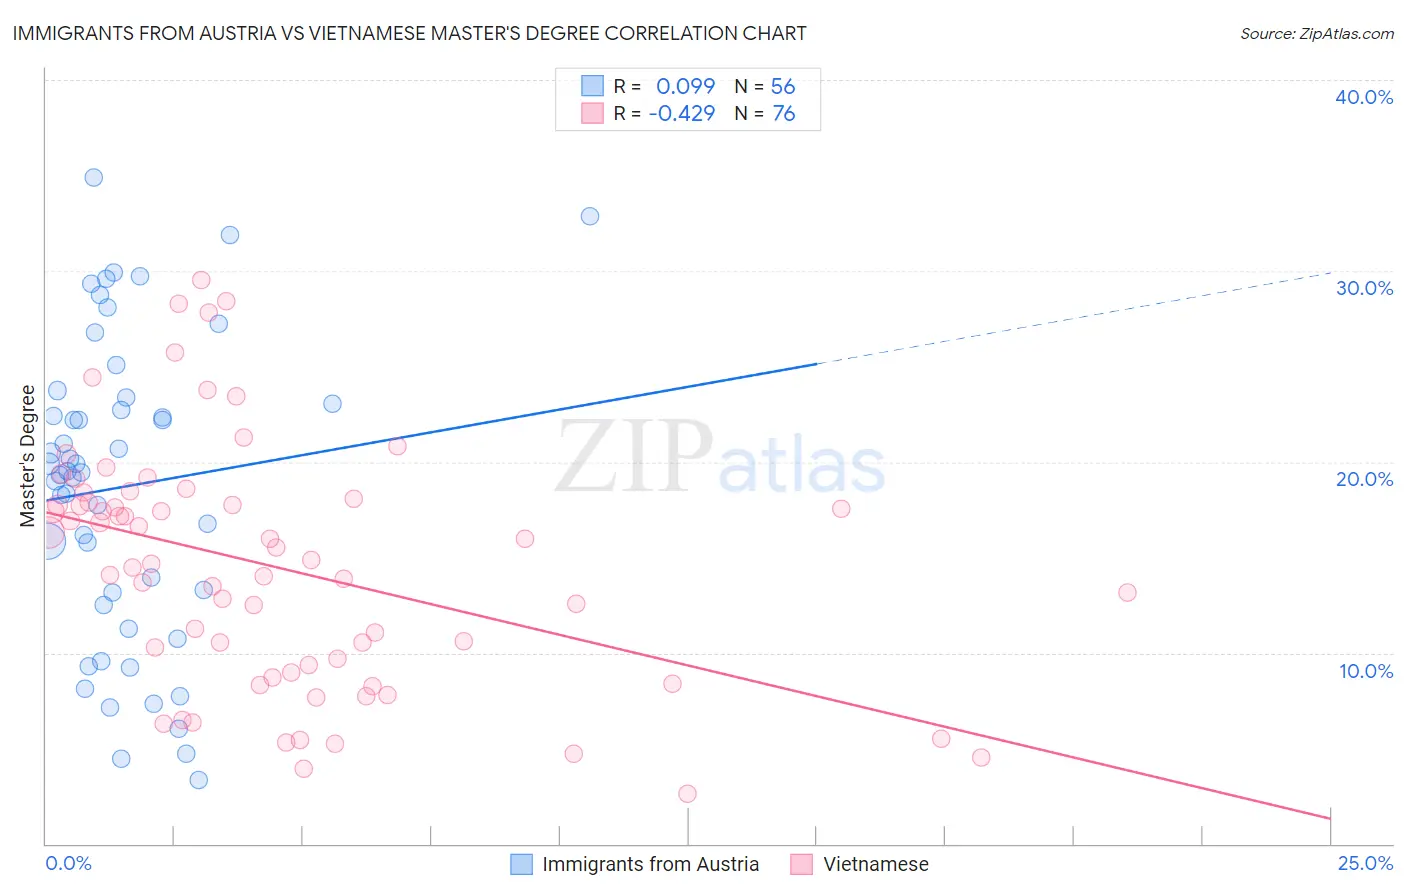
Immigrants from Austria vs Vietnamese Master's Degree Correlation Chart
The statistical analysis conducted on geographies consisting of 167,968,334 people shows a slight positive correlation between the proportion of Immigrants from Austria and percentage of population with at least master's degree education in the United States with a correlation coefficient (R) of 0.099 and weighted average of 18.8%. Similarly, the statistical analysis conducted on geographies consisting of 170,730,532 people shows a moderate negative correlation between the proportion of Vietnamese and percentage of population with at least master's degree education in the United States with a correlation coefficient (R) of -0.429 and weighted average of 15.8%, a difference of 19.4%.
Master's Degree Correlation Summary
| Measurement | Immigrants from Austria | Vietnamese |
| Minimum | 3.4% | 2.6% |
| Maximum | 34.9% | 29.5% |
| Range | 31.5% | 26.9% |
| Mean | 18.7% | 14.5% |
| Median | 19.5% | 14.8% |
| Interquartile 25% (IQ1) | 12.8% | 9.2% |
| Interquartile 75% (IQ3) | 23.2% | 18.0% |
| Interquartile Range (IQR) | 10.4% | 8.8% |
| Standard Deviation (Sample) | 7.9% | 6.4% |
| Standard Deviation (Population) | 7.9% | 6.3% |
Similar Demographics by Master's Degree
Demographics Similar to Immigrants from Austria by Master's Degree
In terms of master's degree, the demographic groups most similar to Immigrants from Austria are Immigrants from Norway (18.8%, a difference of 0.010%), Paraguayan (18.8%, a difference of 0.060%), Estonian (18.8%, a difference of 0.16%), Bulgarian (18.8%, a difference of 0.34%), and Immigrants from South Africa (18.8%, a difference of 0.35%).
| Demographics | Rating | Rank | Master's Degree |
| Immigrants | Bolivia | 100.0 /100 | #40 | Exceptional 19.1% |
| Immigrants | Latvia | 100.0 /100 | #41 | Exceptional 19.1% |
| Immigrants | Saudi Arabia | 100.0 /100 | #42 | Exceptional 19.0% |
| Immigrants | Greece | 100.0 /100 | #43 | Exceptional 19.0% |
| Immigrants | Malaysia | 100.0 /100 | #44 | Exceptional 18.9% |
| Immigrants | Belarus | 100.0 /100 | #45 | Exceptional 18.9% |
| Immigrants | Norway | 100.0 /100 | #46 | Exceptional 18.8% |
| Immigrants | Austria | 100.0 /100 | #47 | Exceptional 18.8% |
| Paraguayans | 100.0 /100 | #48 | Exceptional 18.8% |
| Estonians | 100.0 /100 | #49 | Exceptional 18.8% |
| Bulgarians | 100.0 /100 | #50 | Exceptional 18.8% |
| Immigrants | South Africa | 100.0 /100 | #51 | Exceptional 18.8% |
| Immigrants | Kuwait | 100.0 /100 | #52 | Exceptional 18.6% |
| Immigrants | Czechoslovakia | 99.9 /100 | #53 | Exceptional 18.5% |
| Immigrants | Lithuania | 99.9 /100 | #54 | Exceptional 18.5% |
Demographics Similar to Vietnamese by Master's Degree
In terms of master's degree, the demographic groups most similar to Vietnamese are Immigrants from Germany (15.8%, a difference of 0.090%), Polish (15.7%, a difference of 0.12%), Pakistani (15.8%, a difference of 0.14%), European (15.8%, a difference of 0.22%), and Assyrian/Chaldean/Syriac (15.8%, a difference of 0.33%).
| Demographics | Rating | Rank | Master's Degree |
| Immigrants | Sudan | 90.2 /100 | #133 | Exceptional 16.0% |
| Venezuelans | 88.4 /100 | #134 | Excellent 15.9% |
| South American Indians | 88.4 /100 | #135 | Excellent 15.9% |
| Assyrians/Chaldeans/Syriacs | 86.8 /100 | #136 | Excellent 15.8% |
| Europeans | 86.4 /100 | #137 | Excellent 15.8% |
| Pakistanis | 86.1 /100 | #138 | Excellent 15.8% |
| Immigrants | Germany | 85.9 /100 | #139 | Excellent 15.8% |
| Vietnamese | 85.5 /100 | #140 | Excellent 15.8% |
| Poles | 85.0 /100 | #141 | Excellent 15.7% |
| Immigrants | Africa | 84.0 /100 | #142 | Excellent 15.7% |
| Immigrants | Venezuela | 83.6 /100 | #143 | Excellent 15.7% |
| Canadians | 83.3 /100 | #144 | Excellent 15.7% |
| South Americans | 81.3 /100 | #145 | Excellent 15.6% |
| Immigrants | Afghanistan | 79.4 /100 | #146 | Good 15.6% |
| Hungarians | 79.1 /100 | #147 | Good 15.6% |