Portuguese vs Vietnamese Master's Degree
COMPARE
Portuguese
Vietnamese
Master's Degree
Master's Degree Comparison
Portuguese
Vietnamese
13.9%
MASTER'S DEGREE
11.2/ 100
METRIC RATING
225th/ 347
METRIC RANK
15.8%
MASTER'S DEGREE
85.5/ 100
METRIC RATING
140th/ 347
METRIC RANK
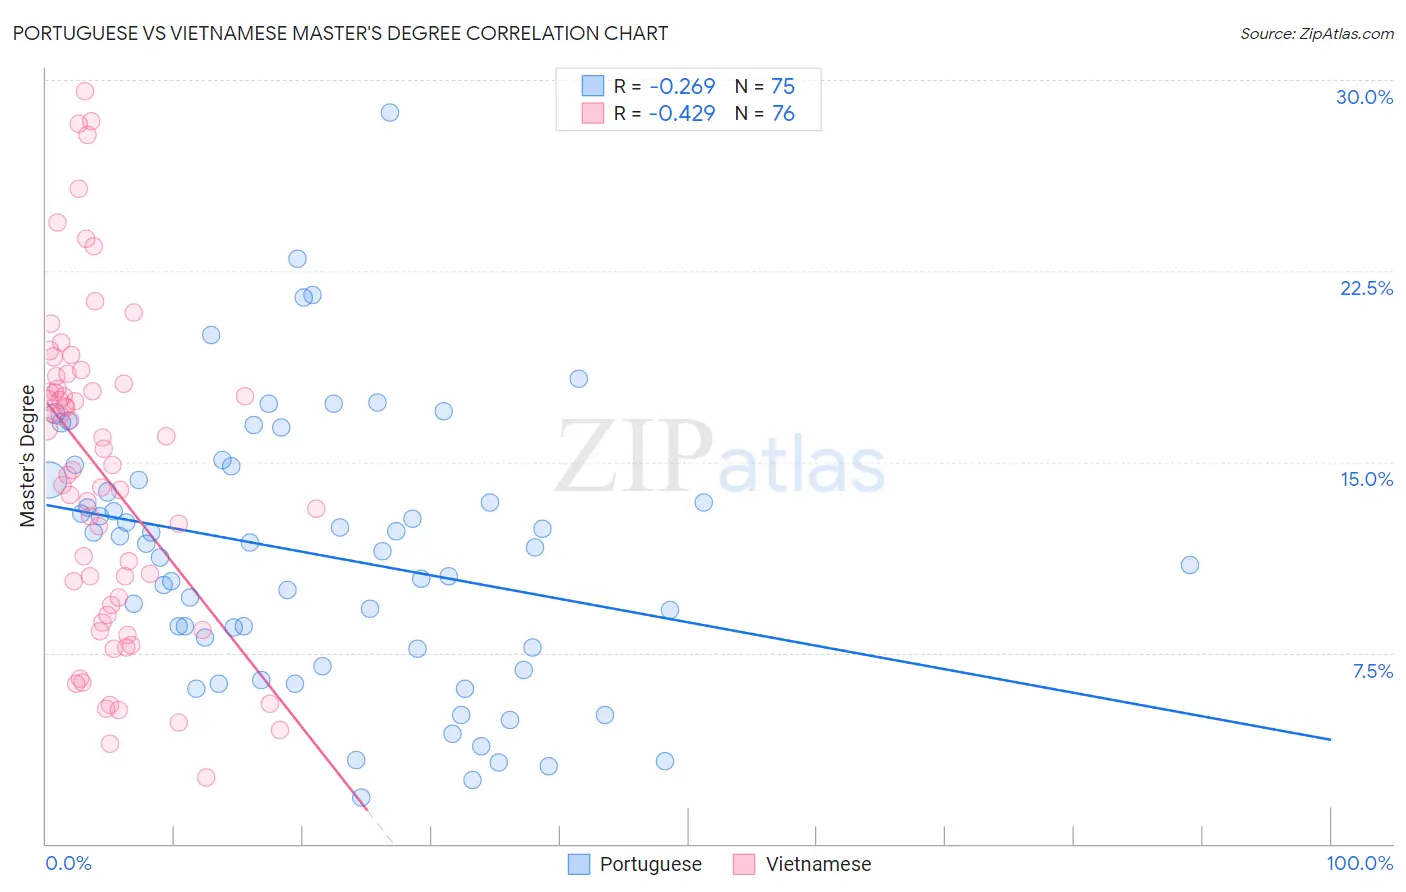
Portuguese vs Vietnamese Master's Degree Correlation Chart
The statistical analysis conducted on geographies consisting of 450,138,380 people shows a weak negative correlation between the proportion of Portuguese and percentage of population with at least master's degree education in the United States with a correlation coefficient (R) of -0.269 and weighted average of 13.9%. Similarly, the statistical analysis conducted on geographies consisting of 170,730,532 people shows a moderate negative correlation between the proportion of Vietnamese and percentage of population with at least master's degree education in the United States with a correlation coefficient (R) of -0.429 and weighted average of 15.8%, a difference of 13.2%.
Master's Degree Correlation Summary
| Measurement | Portuguese | Vietnamese |
| Minimum | 1.8% | 2.6% |
| Maximum | 28.7% | 29.5% |
| Range | 26.9% | 26.9% |
| Mean | 11.3% | 14.5% |
| Median | 11.6% | 14.8% |
| Interquartile 25% (IQ1) | 7.6% | 9.2% |
| Interquartile 75% (IQ3) | 14.3% | 18.0% |
| Interquartile Range (IQR) | 6.7% | 8.8% |
| Standard Deviation (Sample) | 5.3% | 6.4% |
| Standard Deviation (Population) | 5.2% | 6.3% |
Similar Demographics by Master's Degree
Demographics Similar to Portuguese by Master's Degree
In terms of master's degree, the demographic groups most similar to Portuguese are Immigrants from St. Vincent and the Grenadines (13.9%, a difference of 0.050%), Immigrants from Grenada (14.0%, a difference of 0.21%), Immigrants from South Eastern Asia (14.0%, a difference of 0.26%), Ecuadorian (14.0%, a difference of 0.46%), and Korean (14.0%, a difference of 0.49%).
| Demographics | Rating | Rank | Master's Degree |
| French Canadians | 14.9 /100 | #218 | Poor 14.1% |
| Norwegians | 13.6 /100 | #219 | Poor 14.0% |
| Germans | 13.1 /100 | #220 | Poor 14.0% |
| Koreans | 12.7 /100 | #221 | Poor 14.0% |
| Ecuadorians | 12.6 /100 | #222 | Poor 14.0% |
| Immigrants | South Eastern Asia | 11.9 /100 | #223 | Poor 14.0% |
| Immigrants | Grenada | 11.8 /100 | #224 | Poor 14.0% |
| Portuguese | 11.2 /100 | #225 | Poor 13.9% |
| Immigrants | St. Vincent and the Grenadines | 11.0 /100 | #226 | Poor 13.9% |
| Immigrants | West Indies | 9.8 /100 | #227 | Tragic 13.9% |
| Whites/Caucasians | 9.1 /100 | #228 | Tragic 13.8% |
| British West Indians | 8.8 /100 | #229 | Tragic 13.8% |
| Dutch | 8.7 /100 | #230 | Tragic 13.8% |
| Guyanese | 7.6 /100 | #231 | Tragic 13.7% |
| Immigrants | Philippines | 6.0 /100 | #232 | Tragic 13.6% |
Demographics Similar to Vietnamese by Master's Degree
In terms of master's degree, the demographic groups most similar to Vietnamese are Immigrants from Germany (15.8%, a difference of 0.090%), Polish (15.7%, a difference of 0.12%), Pakistani (15.8%, a difference of 0.14%), European (15.8%, a difference of 0.22%), and Assyrian/Chaldean/Syriac (15.8%, a difference of 0.33%).
| Demographics | Rating | Rank | Master's Degree |
| Immigrants | Sudan | 90.2 /100 | #133 | Exceptional 16.0% |
| Venezuelans | 88.4 /100 | #134 | Excellent 15.9% |
| South American Indians | 88.4 /100 | #135 | Excellent 15.9% |
| Assyrians/Chaldeans/Syriacs | 86.8 /100 | #136 | Excellent 15.8% |
| Europeans | 86.4 /100 | #137 | Excellent 15.8% |
| Pakistanis | 86.1 /100 | #138 | Excellent 15.8% |
| Immigrants | Germany | 85.9 /100 | #139 | Excellent 15.8% |
| Vietnamese | 85.5 /100 | #140 | Excellent 15.8% |
| Poles | 85.0 /100 | #141 | Excellent 15.7% |
| Immigrants | Africa | 84.0 /100 | #142 | Excellent 15.7% |
| Immigrants | Venezuela | 83.6 /100 | #143 | Excellent 15.7% |
| Canadians | 83.3 /100 | #144 | Excellent 15.7% |
| South Americans | 81.3 /100 | #145 | Excellent 15.6% |
| Immigrants | Afghanistan | 79.4 /100 | #146 | Good 15.6% |
| Hungarians | 79.1 /100 | #147 | Good 15.6% |