Menominee vs Czechoslovakian Associate's Degree
COMPARE
Menominee
Czechoslovakian
Associate's Degree
Associate's Degree Comparison
Menominee
Czechoslovakians
36.7%
ASSOCIATE'S DEGREE
0.0/ 100
METRIC RATING
325th/ 347
METRIC RANK
46.0%
ASSOCIATE'S DEGREE
40.0/ 100
METRIC RATING
184th/ 347
METRIC RANK
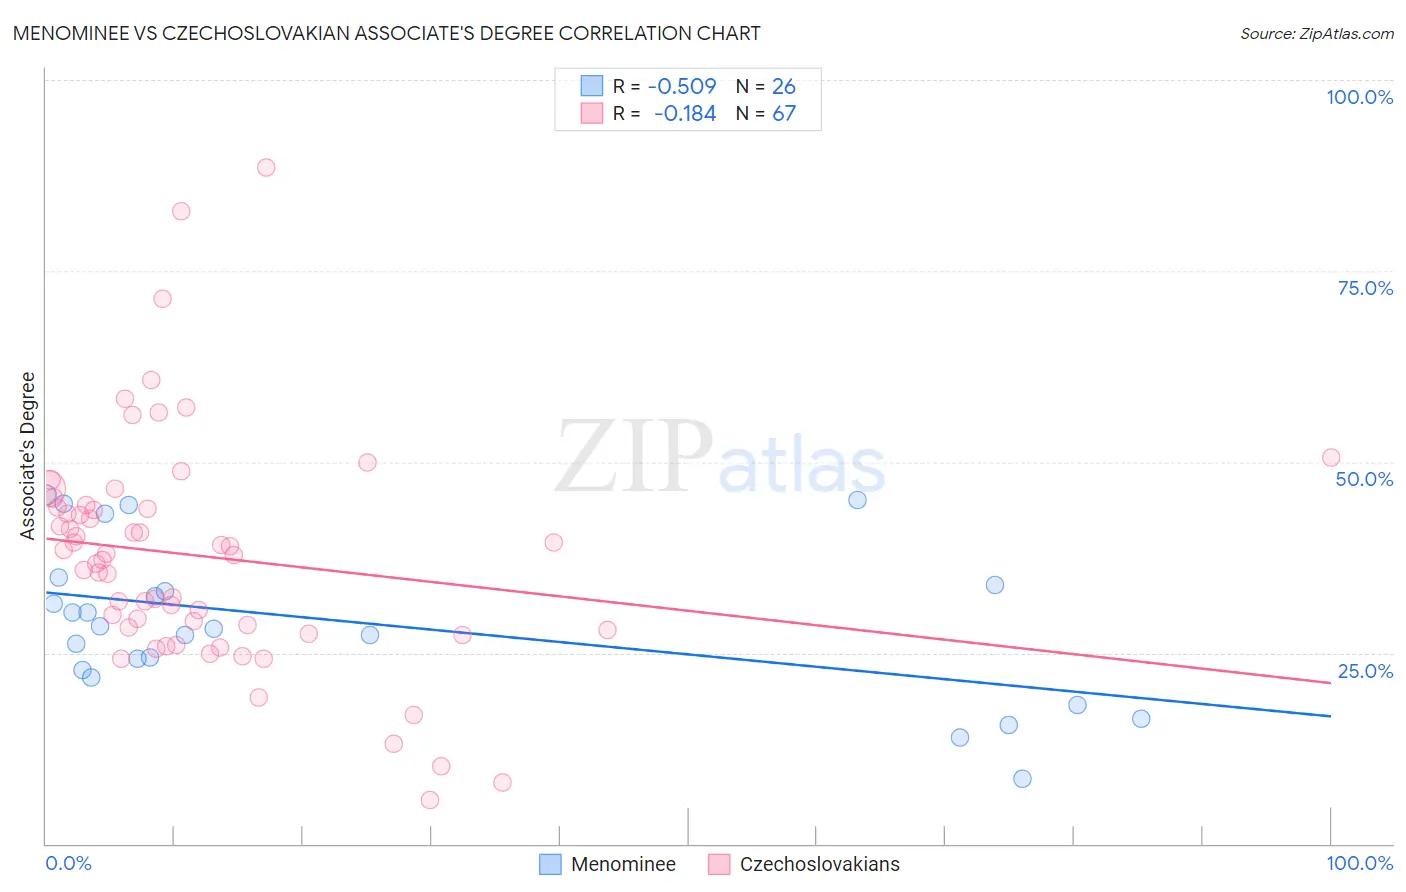
Menominee vs Czechoslovakian Associate's Degree Correlation Chart
The statistical analysis conducted on geographies consisting of 45,778,979 people shows a substantial negative correlation between the proportion of Menominee and percentage of population with at least associate's degree education in the United States with a correlation coefficient (R) of -0.509 and weighted average of 36.7%. Similarly, the statistical analysis conducted on geographies consisting of 368,660,591 people shows a poor negative correlation between the proportion of Czechoslovakians and percentage of population with at least associate's degree education in the United States with a correlation coefficient (R) of -0.184 and weighted average of 46.0%, a difference of 25.4%.
Associate's Degree Correlation Summary
| Measurement | Menominee | Czechoslovakian |
| Minimum | 8.5% | 5.7% |
| Maximum | 45.6% | 88.6% |
| Range | 37.1% | 82.8% |
| Mean | 28.9% | 37.6% |
| Median | 28.3% | 37.8% |
| Interquartile 25% (IQ1) | 22.8% | 28.0% |
| Interquartile 75% (IQ3) | 33.8% | 44.1% |
| Interquartile Range (IQR) | 11.0% | 16.1% |
| Standard Deviation (Sample) | 10.1% | 15.1% |
| Standard Deviation (Population) | 9.9% | 15.0% |
Similar Demographics by Associate's Degree
Demographics Similar to Menominee by Associate's Degree
In terms of associate's degree, the demographic groups most similar to Menominee are Arapaho (36.7%, a difference of 0.11%), Immigrants from Cabo Verde (36.8%, a difference of 0.27%), Kiowa (36.5%, a difference of 0.56%), Dutch West Indian (36.5%, a difference of 0.58%), and Alaskan Athabascan (36.5%, a difference of 0.59%).
| Demographics | Rating | Rank | Associate's Degree |
| Alaska Natives | 0.0 /100 | #318 | Tragic 37.5% |
| Fijians | 0.0 /100 | #319 | Tragic 37.4% |
| Cajuns | 0.0 /100 | #320 | Tragic 37.4% |
| Immigrants | Yemen | 0.0 /100 | #321 | Tragic 37.3% |
| Pennsylvania Germans | 0.0 /100 | #322 | Tragic 37.2% |
| Immigrants | Cabo Verde | 0.0 /100 | #323 | Tragic 36.8% |
| Arapaho | 0.0 /100 | #324 | Tragic 36.7% |
| Menominee | 0.0 /100 | #325 | Tragic 36.7% |
| Kiowa | 0.0 /100 | #326 | Tragic 36.5% |
| Dutch West Indians | 0.0 /100 | #327 | Tragic 36.5% |
| Alaskan Athabascans | 0.0 /100 | #328 | Tragic 36.5% |
| Paiute | 0.0 /100 | #329 | Tragic 36.4% |
| Apache | 0.0 /100 | #330 | Tragic 36.2% |
| Immigrants | Azores | 0.0 /100 | #331 | Tragic 35.6% |
| Immigrants | Central America | 0.0 /100 | #332 | Tragic 35.0% |
Demographics Similar to Czechoslovakians by Associate's Degree
In terms of associate's degree, the demographic groups most similar to Czechoslovakians are Yugoslavian (46.0%, a difference of 0.020%), Swiss (46.0%, a difference of 0.030%), Immigrants from Colombia (46.0%, a difference of 0.10%), Costa Rican (46.0%, a difference of 0.11%), and Welsh (45.9%, a difference of 0.17%).
| Demographics | Rating | Rank | Associate's Degree |
| Slovaks | 48.4 /100 | #177 | Average 46.3% |
| Immigrants | Bosnia and Herzegovina | 48.3 /100 | #178 | Average 46.3% |
| Sri Lankans | 47.6 /100 | #179 | Average 46.3% |
| Bermudans | 46.4 /100 | #180 | Average 46.2% |
| Immigrants | Colombia | 41.3 /100 | #181 | Average 46.0% |
| Swiss | 40.4 /100 | #182 | Average 46.0% |
| Yugoslavians | 40.2 /100 | #183 | Average 46.0% |
| Czechoslovakians | 40.0 /100 | #184 | Average 46.0% |
| Costa Ricans | 38.6 /100 | #185 | Fair 46.0% |
| Welsh | 37.9 /100 | #186 | Fair 45.9% |
| Immigrants | Uruguay | 35.5 /100 | #187 | Fair 45.8% |
| Ghanaians | 35.5 /100 | #188 | Fair 45.8% |
| Immigrants | Oceania | 34.7 /100 | #189 | Fair 45.8% |
| Vietnamese | 34.0 /100 | #190 | Fair 45.8% |
| Koreans | 33.8 /100 | #191 | Fair 45.8% |