Immigrants from Southern Europe vs Czechoslovakian Associate's Degree
COMPARE
Immigrants from Southern Europe
Czechoslovakian
Associate's Degree
Associate's Degree Comparison
Immigrants from Southern Europe
Czechoslovakians
47.8%
ASSOCIATE'S DEGREE
84.4/ 100
METRIC RATING
140th/ 347
METRIC RANK
46.0%
ASSOCIATE'S DEGREE
40.0/ 100
METRIC RATING
184th/ 347
METRIC RANK
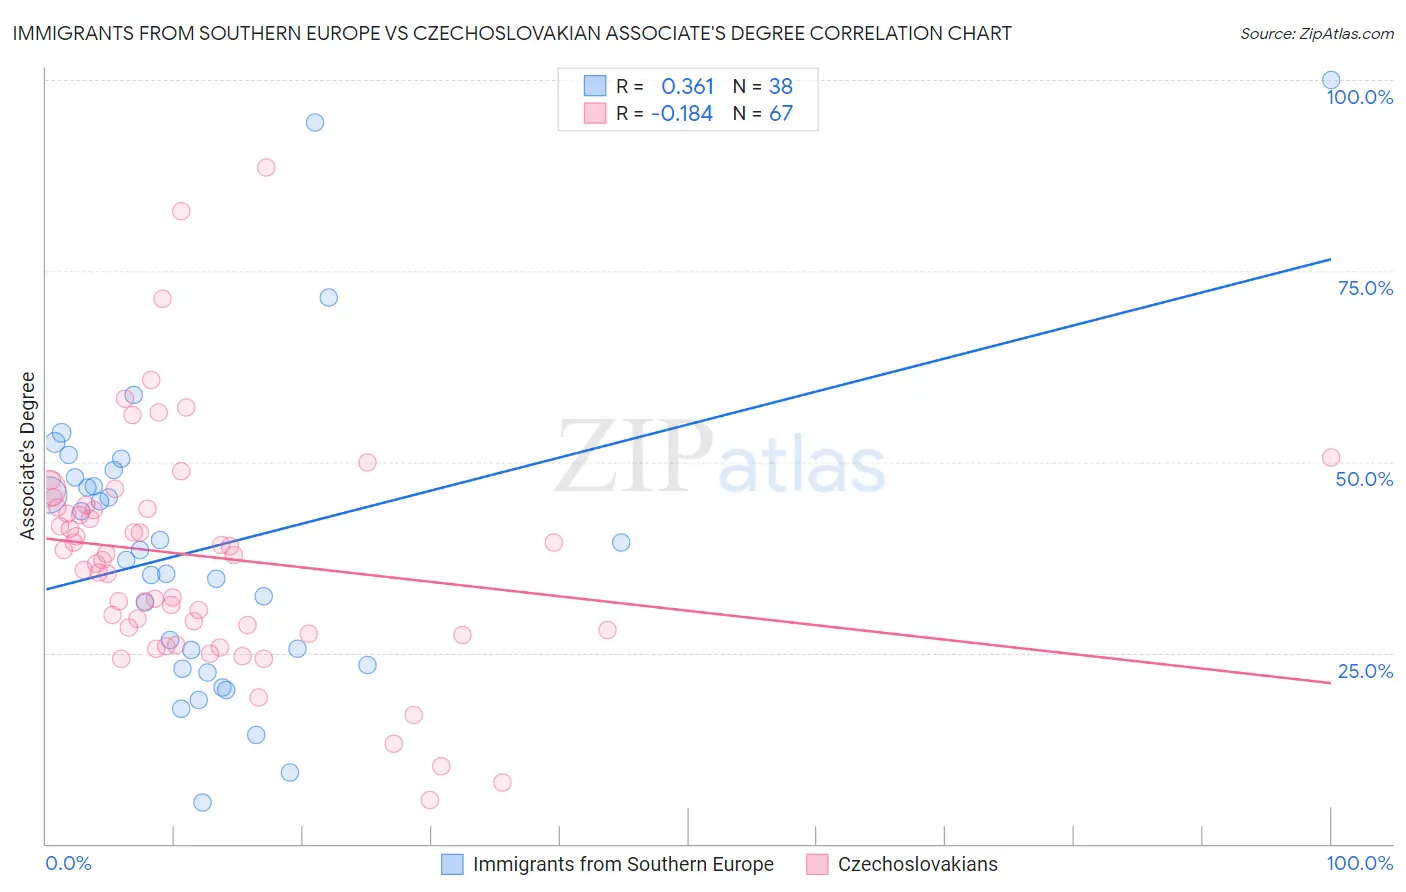
Immigrants from Southern Europe vs Czechoslovakian Associate's Degree Correlation Chart
The statistical analysis conducted on geographies consisting of 402,795,863 people shows a mild positive correlation between the proportion of Immigrants from Southern Europe and percentage of population with at least associate's degree education in the United States with a correlation coefficient (R) of 0.361 and weighted average of 47.8%. Similarly, the statistical analysis conducted on geographies consisting of 368,660,591 people shows a poor negative correlation between the proportion of Czechoslovakians and percentage of population with at least associate's degree education in the United States with a correlation coefficient (R) of -0.184 and weighted average of 46.0%, a difference of 3.9%.
Associate's Degree Correlation Summary
| Measurement | Immigrants from Southern Europe | Czechoslovakian |
| Minimum | 5.4% | 5.7% |
| Maximum | 100.0% | 88.6% |
| Range | 94.6% | 82.8% |
| Mean | 38.9% | 37.6% |
| Median | 37.8% | 37.8% |
| Interquartile 25% (IQ1) | 23.3% | 28.0% |
| Interquartile 75% (IQ3) | 48.0% | 44.1% |
| Interquartile Range (IQR) | 24.7% | 16.1% |
| Standard Deviation (Sample) | 20.1% | 15.1% |
| Standard Deviation (Population) | 19.9% | 15.0% |
Similar Demographics by Associate's Degree
Demographics Similar to Immigrants from Southern Europe by Associate's Degree
In terms of associate's degree, the demographic groups most similar to Immigrants from Southern Europe are Slovene (47.9%, a difference of 0.090%), Taiwanese (47.7%, a difference of 0.15%), Sierra Leonean (47.7%, a difference of 0.20%), Norwegian (47.6%, a difference of 0.43%), and Polish (48.0%, a difference of 0.44%).
| Demographics | Rating | Rank | Associate's Degree |
| Assyrians/Chaldeans/Syriacs | 89.4 /100 | #133 | Excellent 48.2% |
| Moroccans | 89.3 /100 | #134 | Excellent 48.2% |
| Europeans | 89.0 /100 | #135 | Excellent 48.2% |
| Pakistanis | 88.0 /100 | #136 | Excellent 48.1% |
| Immigrants | Eritrea | 87.8 /100 | #137 | Excellent 48.1% |
| Poles | 87.3 /100 | #138 | Excellent 48.0% |
| Slovenes | 85.1 /100 | #139 | Excellent 47.9% |
| Immigrants | Southern Europe | 84.4 /100 | #140 | Excellent 47.8% |
| Taiwanese | 83.3 /100 | #141 | Excellent 47.7% |
| Sierra Leoneans | 82.9 /100 | #142 | Excellent 47.7% |
| Norwegians | 81.0 /100 | #143 | Excellent 47.6% |
| Slavs | 80.5 /100 | #144 | Excellent 47.6% |
| Canadians | 79.0 /100 | #145 | Good 47.5% |
| Immigrants | Sudan | 77.9 /100 | #146 | Good 47.4% |
| Danes | 77.3 /100 | #147 | Good 47.4% |
Demographics Similar to Czechoslovakians by Associate's Degree
In terms of associate's degree, the demographic groups most similar to Czechoslovakians are Yugoslavian (46.0%, a difference of 0.020%), Swiss (46.0%, a difference of 0.030%), Immigrants from Colombia (46.0%, a difference of 0.10%), Costa Rican (46.0%, a difference of 0.11%), and Welsh (45.9%, a difference of 0.17%).
| Demographics | Rating | Rank | Associate's Degree |
| Slovaks | 48.4 /100 | #177 | Average 46.3% |
| Immigrants | Bosnia and Herzegovina | 48.3 /100 | #178 | Average 46.3% |
| Sri Lankans | 47.6 /100 | #179 | Average 46.3% |
| Bermudans | 46.4 /100 | #180 | Average 46.2% |
| Immigrants | Colombia | 41.3 /100 | #181 | Average 46.0% |
| Swiss | 40.4 /100 | #182 | Average 46.0% |
| Yugoslavians | 40.2 /100 | #183 | Average 46.0% |
| Czechoslovakians | 40.0 /100 | #184 | Average 46.0% |
| Costa Ricans | 38.6 /100 | #185 | Fair 46.0% |
| Welsh | 37.9 /100 | #186 | Fair 45.9% |
| Immigrants | Uruguay | 35.5 /100 | #187 | Fair 45.8% |
| Ghanaians | 35.5 /100 | #188 | Fair 45.8% |
| Immigrants | Oceania | 34.7 /100 | #189 | Fair 45.8% |
| Vietnamese | 34.0 /100 | #190 | Fair 45.8% |
| Koreans | 33.8 /100 | #191 | Fair 45.8% |