Menominee vs Czechoslovakian Unemployment Among Ages 16 to 19 years
COMPARE
Menominee
Czechoslovakian
Unemployment Among Ages 16 to 19 years
Unemployment Among Ages 16 to 19 years Comparison
Menominee
Czechoslovakians
16.6%
UNEMPLOYMENT AMONG AGES 16 TO 19 YEARS
99.3/ 100
METRIC RATING
60th/ 347
METRIC RANK
16.5%
UNEMPLOYMENT AMONG AGES 16 TO 19 YEARS
99.5/ 100
METRIC RATING
55th/ 347
METRIC RANK
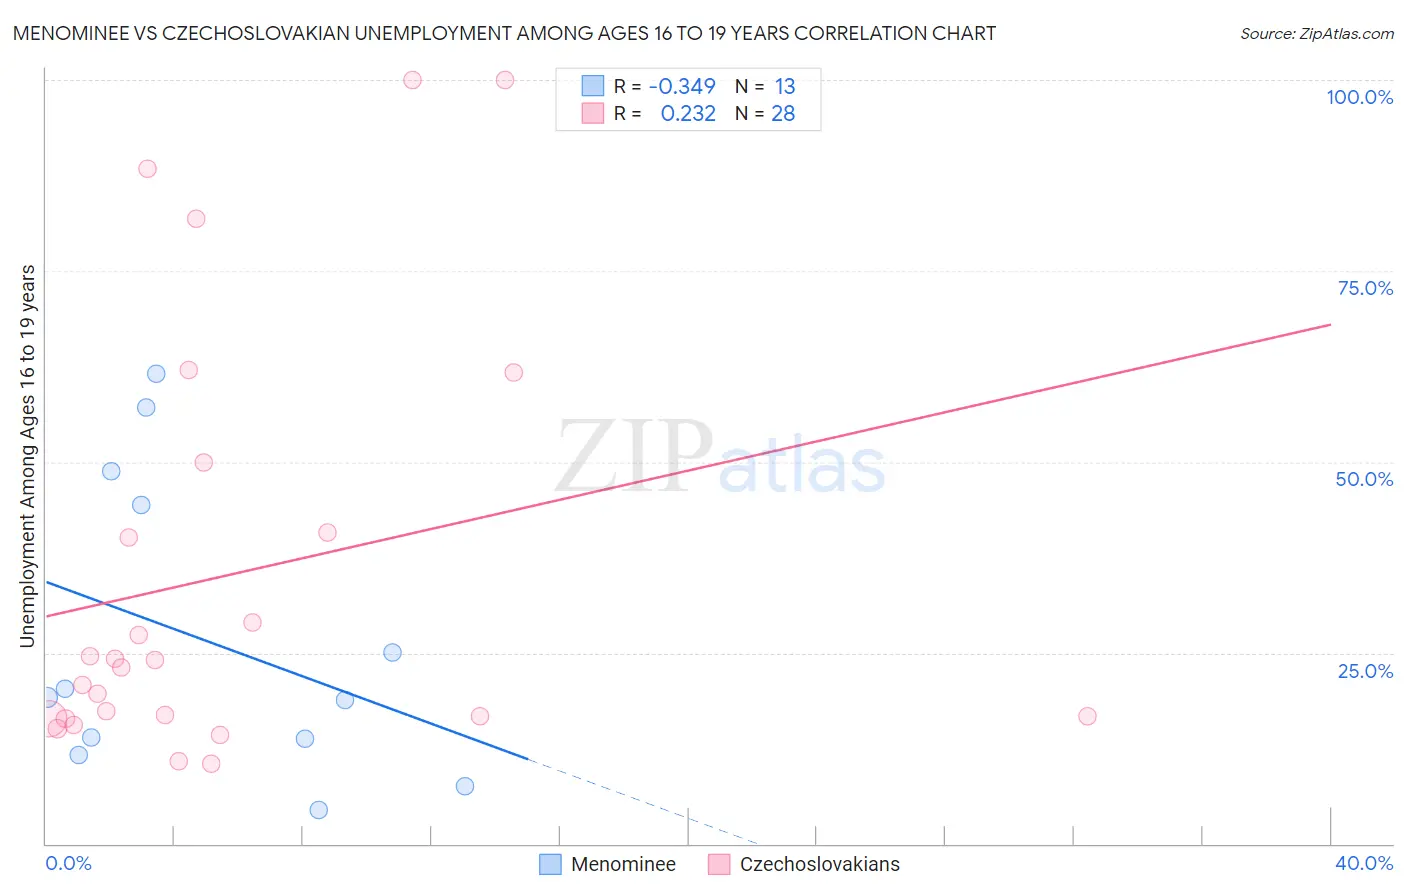
Menominee vs Czechoslovakian Unemployment Among Ages 16 to 19 years Correlation Chart
The statistical analysis conducted on geographies consisting of 45,021,333 people shows a mild negative correlation between the proportion of Menominee and unemployment rate among population between the ages 16 and 19 in the United States with a correlation coefficient (R) of -0.349 and weighted average of 16.6%. Similarly, the statistical analysis conducted on geographies consisting of 347,771,610 people shows a weak positive correlation between the proportion of Czechoslovakians and unemployment rate among population between the ages 16 and 19 in the United States with a correlation coefficient (R) of 0.232 and weighted average of 16.5%, a difference of 0.57%.
Unemployment Among Ages 16 to 19 years Correlation Summary
| Measurement | Menominee | Czechoslovakian |
| Minimum | 4.4% | 10.5% |
| Maximum | 61.5% | 100.0% |
| Range | 57.1% | 89.5% |
| Mean | 26.6% | 35.1% |
| Median | 19.2% | 23.5% |
| Interquartile 25% (IQ1) | 12.7% | 16.6% |
| Interquartile 75% (IQ3) | 46.6% | 45.4% |
| Interquartile Range (IQR) | 33.9% | 28.8% |
| Standard Deviation (Sample) | 19.4% | 27.6% |
| Standard Deviation (Population) | 18.7% | 27.1% |
Demographics Similar to Menominee and Czechoslovakians by Unemployment Among Ages 16 to 19 years
In terms of unemployment among ages 16 to 19 years, the demographic groups most similar to Menominee are Immigrants from Cuba (16.6%, a difference of 0.060%), Macedonian (16.6%, a difference of 0.16%), Irish (16.5%, a difference of 0.17%), Immigrants from Uganda (16.5%, a difference of 0.22%), and Immigrants from Jordan (16.5%, a difference of 0.27%). Similarly, the demographic groups most similar to Czechoslovakians are British (16.5%, a difference of 0.020%), Sri Lankan (16.5%, a difference of 0.020%), Slovene (16.4%, a difference of 0.080%), Welsh (16.4%, a difference of 0.16%), and Lebanese (16.4%, a difference of 0.19%).
| Demographics | Rating | Rank | Unemployment Among Ages 16 to 19 years |
| Immigrants | Vietnam | 99.7 /100 | #47 | Exceptional 16.4% |
| Maltese | 99.7 /100 | #48 | Exceptional 16.4% |
| Iraqis | 99.7 /100 | #49 | Exceptional 16.4% |
| Bhutanese | 99.6 /100 | #50 | Exceptional 16.4% |
| Lebanese | 99.6 /100 | #51 | Exceptional 16.4% |
| Welsh | 99.6 /100 | #52 | Exceptional 16.4% |
| Slovenes | 99.6 /100 | #53 | Exceptional 16.4% |
| British | 99.5 /100 | #54 | Exceptional 16.5% |
| Czechoslovakians | 99.5 /100 | #55 | Exceptional 16.5% |
| Sri Lankans | 99.5 /100 | #56 | Exceptional 16.5% |
| Immigrants | Jordan | 99.4 /100 | #57 | Exceptional 16.5% |
| Immigrants | Uganda | 99.4 /100 | #58 | Exceptional 16.5% |
| Irish | 99.4 /100 | #59 | Exceptional 16.5% |
| Menominee | 99.3 /100 | #60 | Exceptional 16.6% |
| Immigrants | Cuba | 99.2 /100 | #61 | Exceptional 16.6% |
| Macedonians | 99.2 /100 | #62 | Exceptional 16.6% |
| Scotch-Irish | 99.1 /100 | #63 | Exceptional 16.6% |
| Northern Europeans | 99.0 /100 | #64 | Exceptional 16.6% |
| Immigrants | Japan | 98.9 /100 | #65 | Exceptional 16.6% |
| Okinawans | 98.9 /100 | #66 | Exceptional 16.6% |
| Slavs | 98.7 /100 | #67 | Exceptional 16.7% |