Marshallese vs Nepalese 10th Grade
COMPARE
Marshallese
Nepalese
10th Grade
10th Grade Comparison
Marshallese
Nepalese
93.6%
10TH GRADE
33.2/ 100
METRIC RATING
188th/ 347
METRIC RANK
90.7%
10TH GRADE
0.0/ 100
METRIC RATING
314th/ 347
METRIC RANK
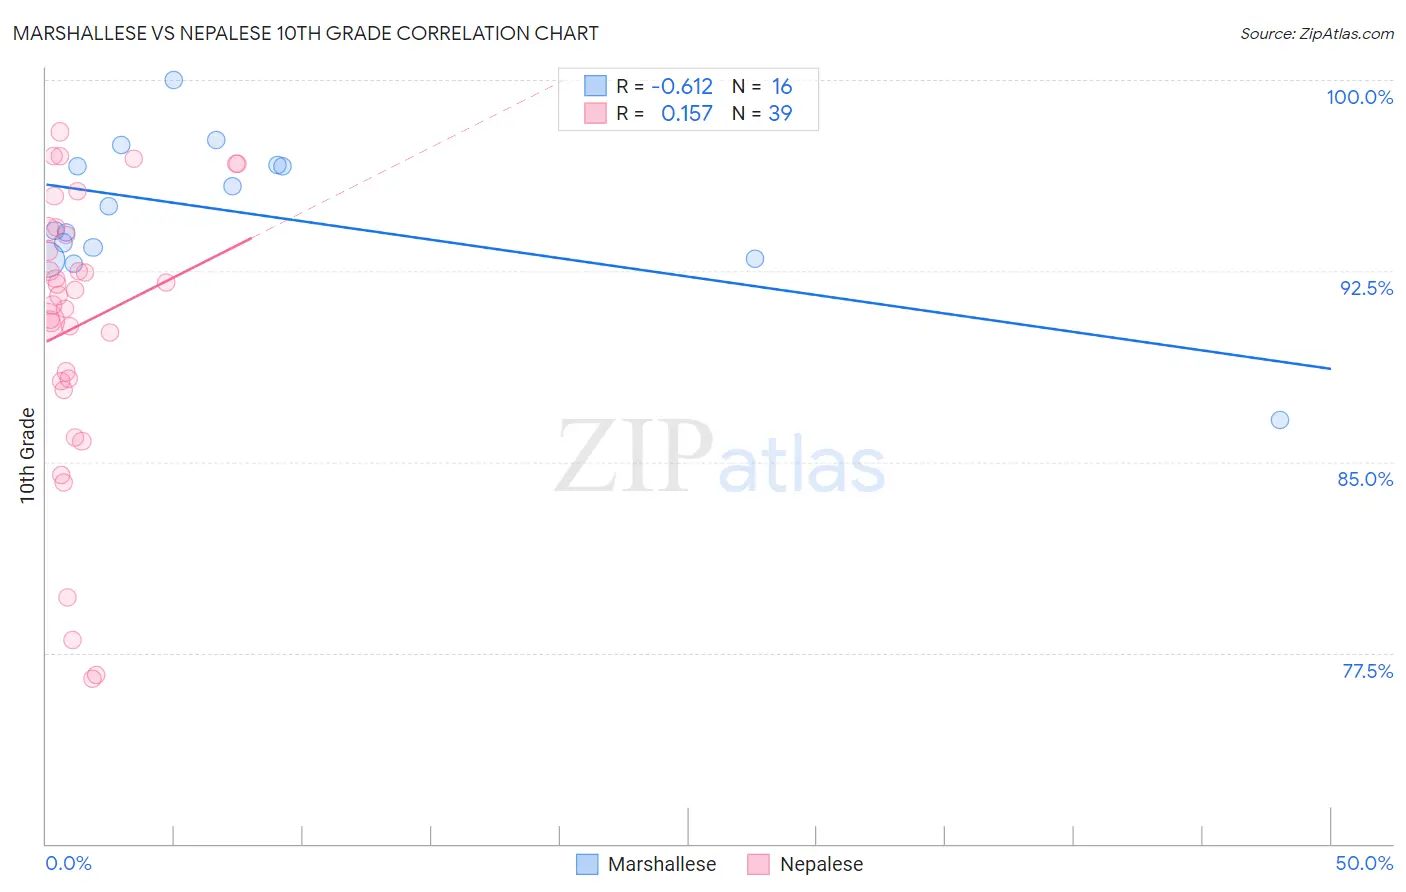
Marshallese vs Nepalese 10th Grade Correlation Chart
The statistical analysis conducted on geographies consisting of 14,761,315 people shows a significant negative correlation between the proportion of Marshallese and percentage of population with at least 10th grade education in the United States with a correlation coefficient (R) of -0.612 and weighted average of 93.6%. Similarly, the statistical analysis conducted on geographies consisting of 24,519,269 people shows a poor positive correlation between the proportion of Nepalese and percentage of population with at least 10th grade education in the United States with a correlation coefficient (R) of 0.157 and weighted average of 90.7%, a difference of 3.2%.
10th Grade Correlation Summary
| Measurement | Marshallese | Nepalese |
| Minimum | 86.6% | 76.5% |
| Maximum | 100.0% | 98.0% |
| Range | 13.4% | 21.5% |
| Mean | 94.8% | 90.4% |
| Median | 94.6% | 91.5% |
| Interquartile 25% (IQ1) | 93.2% | 88.2% |
| Interquartile 75% (IQ3) | 96.6% | 94.1% |
| Interquartile Range (IQR) | 3.4% | 6.0% |
| Standard Deviation (Sample) | 3.0% | 5.6% |
| Standard Deviation (Population) | 2.9% | 5.5% |
Similar Demographics by 10th Grade
Demographics Similar to Marshallese by 10th Grade
In terms of 10th grade, the demographic groups most similar to Marshallese are Immigrants from Pakistan (93.6%, a difference of 0.010%), Laotian (93.6%, a difference of 0.010%), Immigrants from Eastern Asia (93.6%, a difference of 0.020%), Liberian (93.6%, a difference of 0.020%), and Yup'ik (93.6%, a difference of 0.020%).
| Demographics | Rating | Rank | 10th Grade |
| Immigrants | Northern Africa | 41.6 /100 | #181 | Average 93.7% |
| Colville | 38.8 /100 | #182 | Fair 93.6% |
| Guamanians/Chamorros | 37.1 /100 | #183 | Fair 93.6% |
| Choctaw | 36.6 /100 | #184 | Fair 93.6% |
| Sudanese | 36.6 /100 | #185 | Fair 93.6% |
| Immigrants | Eastern Asia | 35.1 /100 | #186 | Fair 93.6% |
| Liberians | 34.7 /100 | #187 | Fair 93.6% |
| Marshallese | 33.2 /100 | #188 | Fair 93.6% |
| Immigrants | Pakistan | 32.5 /100 | #189 | Fair 93.6% |
| Laotians | 32.1 /100 | #190 | Fair 93.6% |
| Yup'ik | 31.1 /100 | #191 | Fair 93.6% |
| Immigrants | Malaysia | 28.0 /100 | #192 | Fair 93.5% |
| Panamanians | 28.0 /100 | #193 | Fair 93.5% |
| Immigrants | Morocco | 26.9 /100 | #194 | Fair 93.5% |
| Cheyenne | 26.8 /100 | #195 | Fair 93.5% |
Demographics Similar to Nepalese by 10th Grade
In terms of 10th grade, the demographic groups most similar to Nepalese are Cape Verdean (90.8%, a difference of 0.080%), Immigrants from Caribbean (90.6%, a difference of 0.080%), Ecuadorian (90.6%, a difference of 0.090%), Immigrants from Portugal (90.8%, a difference of 0.11%), and Immigrants from Ecuador (90.4%, a difference of 0.26%).
| Demographics | Rating | Rank | 10th Grade |
| Immigrants | Fiji | 0.0 /100 | #307 | Tragic 91.0% |
| Immigrants | Bangladesh | 0.0 /100 | #308 | Tragic 91.0% |
| Immigrants | Immigrants | 0.0 /100 | #309 | Tragic 91.0% |
| Vietnamese | 0.0 /100 | #310 | Tragic 90.9% |
| Immigrants | Cambodia | 0.0 /100 | #311 | Tragic 90.9% |
| Immigrants | Portugal | 0.0 /100 | #312 | Tragic 90.8% |
| Cape Verdeans | 0.0 /100 | #313 | Tragic 90.8% |
| Nepalese | 0.0 /100 | #314 | Tragic 90.7% |
| Immigrants | Caribbean | 0.0 /100 | #315 | Tragic 90.6% |
| Ecuadorians | 0.0 /100 | #316 | Tragic 90.6% |
| Immigrants | Ecuador | 0.0 /100 | #317 | Tragic 90.4% |
| Immigrants | Cuba | 0.0 /100 | #318 | Tragic 90.2% |
| Nicaraguans | 0.0 /100 | #319 | Tragic 90.2% |
| Houma | 0.0 /100 | #320 | Tragic 90.2% |
| Belizeans | 0.0 /100 | #321 | Tragic 90.2% |