Immigrants from Portugal vs Nepalese 10th Grade
COMPARE
Immigrants from Portugal
Nepalese
10th Grade
10th Grade Comparison
Immigrants from Portugal
Nepalese
90.8%
10TH GRADE
0.0/ 100
METRIC RATING
312th/ 347
METRIC RANK
90.7%
10TH GRADE
0.0/ 100
METRIC RATING
314th/ 347
METRIC RANK
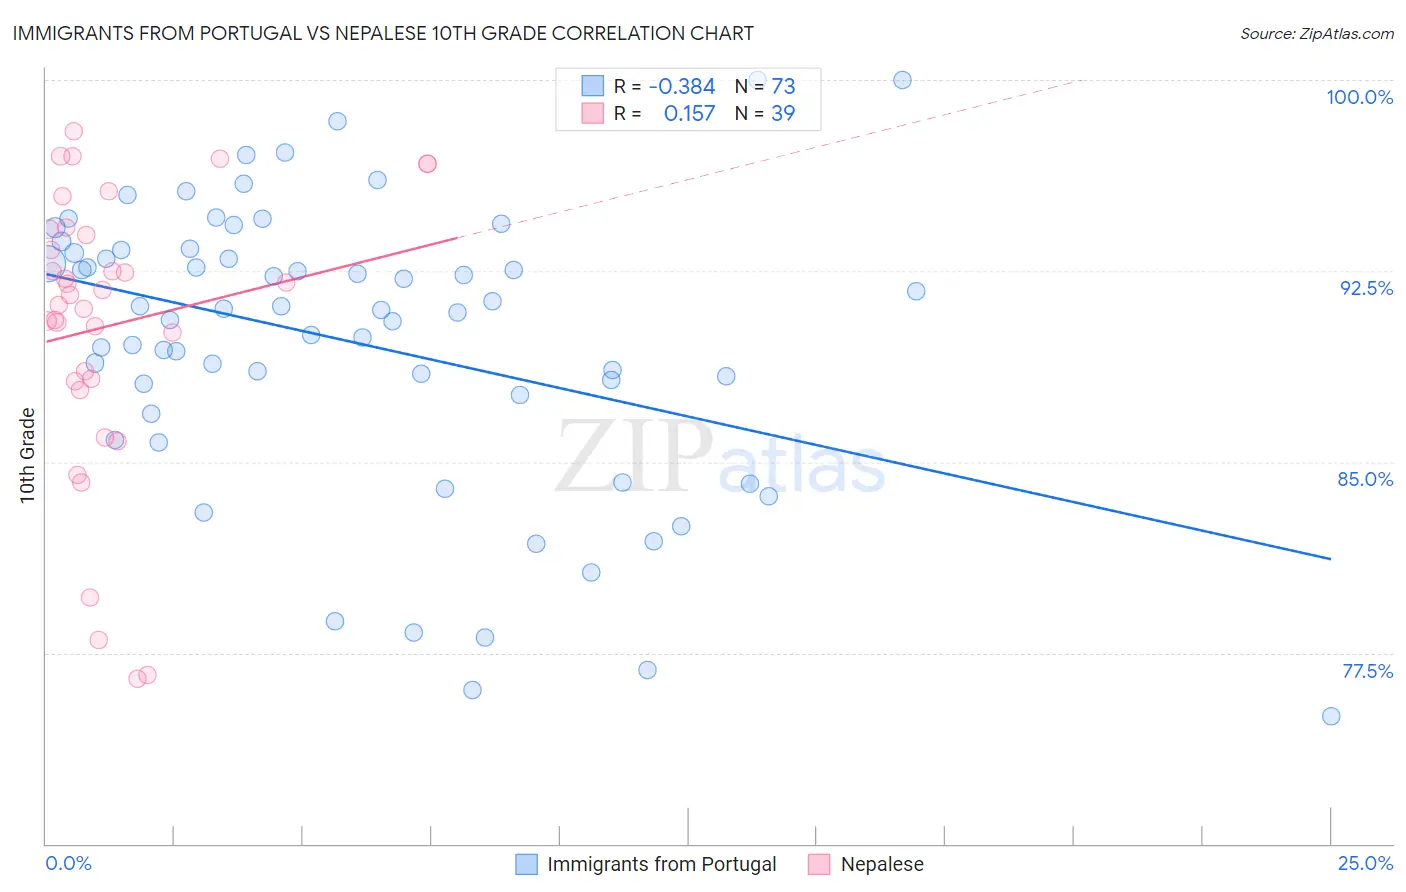
Immigrants from Portugal vs Nepalese 10th Grade Correlation Chart
The statistical analysis conducted on geographies consisting of 174,792,107 people shows a mild negative correlation between the proportion of Immigrants from Portugal and percentage of population with at least 10th grade education in the United States with a correlation coefficient (R) of -0.384 and weighted average of 90.8%. Similarly, the statistical analysis conducted on geographies consisting of 24,519,269 people shows a poor positive correlation between the proportion of Nepalese and percentage of population with at least 10th grade education in the United States with a correlation coefficient (R) of 0.157 and weighted average of 90.7%, a difference of 0.11%.
10th Grade Correlation Summary
| Measurement | Immigrants from Portugal | Nepalese |
| Minimum | 75.0% | 76.5% |
| Maximum | 100.0% | 98.0% |
| Range | 25.0% | 21.5% |
| Mean | 89.7% | 90.4% |
| Median | 91.0% | 91.5% |
| Interquartile 25% (IQ1) | 87.3% | 88.2% |
| Interquartile 75% (IQ3) | 93.3% | 94.1% |
| Interquartile Range (IQR) | 6.0% | 6.0% |
| Standard Deviation (Sample) | 5.6% | 5.6% |
| Standard Deviation (Population) | 5.6% | 5.5% |
Demographics Similar to Immigrants from Portugal and Nepalese by 10th Grade
In terms of 10th grade, the demographic groups most similar to Immigrants from Portugal are Cape Verdean (90.8%, a difference of 0.030%), Immigrants from Cambodia (90.9%, a difference of 0.16%), Vietnamese (90.9%, a difference of 0.19%), Immigrants from Caribbean (90.6%, a difference of 0.19%), and Ecuadorian (90.6%, a difference of 0.20%). Similarly, the demographic groups most similar to Nepalese are Cape Verdean (90.8%, a difference of 0.080%), Immigrants from Caribbean (90.6%, a difference of 0.080%), Ecuadorian (90.6%, a difference of 0.090%), Immigrants from Ecuador (90.4%, a difference of 0.26%), and Immigrants from Cambodia (90.9%, a difference of 0.27%).
| Demographics | Rating | Rank | 10th Grade |
| Immigrants | Vietnam | 0.0 /100 | #303 | Tragic 91.2% |
| Pima | 0.0 /100 | #304 | Tragic 91.2% |
| Immigrants | Dominica | 0.0 /100 | #305 | Tragic 91.1% |
| Yaqui | 0.0 /100 | #306 | Tragic 91.1% |
| Immigrants | Fiji | 0.0 /100 | #307 | Tragic 91.0% |
| Immigrants | Bangladesh | 0.0 /100 | #308 | Tragic 91.0% |
| Immigrants | Immigrants | 0.0 /100 | #309 | Tragic 91.0% |
| Vietnamese | 0.0 /100 | #310 | Tragic 90.9% |
| Immigrants | Cambodia | 0.0 /100 | #311 | Tragic 90.9% |
| Immigrants | Portugal | 0.0 /100 | #312 | Tragic 90.8% |
| Cape Verdeans | 0.0 /100 | #313 | Tragic 90.8% |
| Nepalese | 0.0 /100 | #314 | Tragic 90.7% |
| Immigrants | Caribbean | 0.0 /100 | #315 | Tragic 90.6% |
| Ecuadorians | 0.0 /100 | #316 | Tragic 90.6% |
| Immigrants | Ecuador | 0.0 /100 | #317 | Tragic 90.4% |
| Immigrants | Cuba | 0.0 /100 | #318 | Tragic 90.2% |
| Nicaraguans | 0.0 /100 | #319 | Tragic 90.2% |
| Houma | 0.0 /100 | #320 | Tragic 90.2% |
| Belizeans | 0.0 /100 | #321 | Tragic 90.2% |
| Tohono O'odham | 0.0 /100 | #322 | Tragic 90.1% |
| Immigrants | Belize | 0.0 /100 | #323 | Tragic 90.1% |