Marshallese vs Tongan 10th Grade
COMPARE
Marshallese
Tongan
10th Grade
10th Grade Comparison
Marshallese
Tongans
93.6%
10TH GRADE
33.2/ 100
METRIC RATING
188th/ 347
METRIC RANK
93.3%
10TH GRADE
9.5/ 100
METRIC RATING
220th/ 347
METRIC RANK
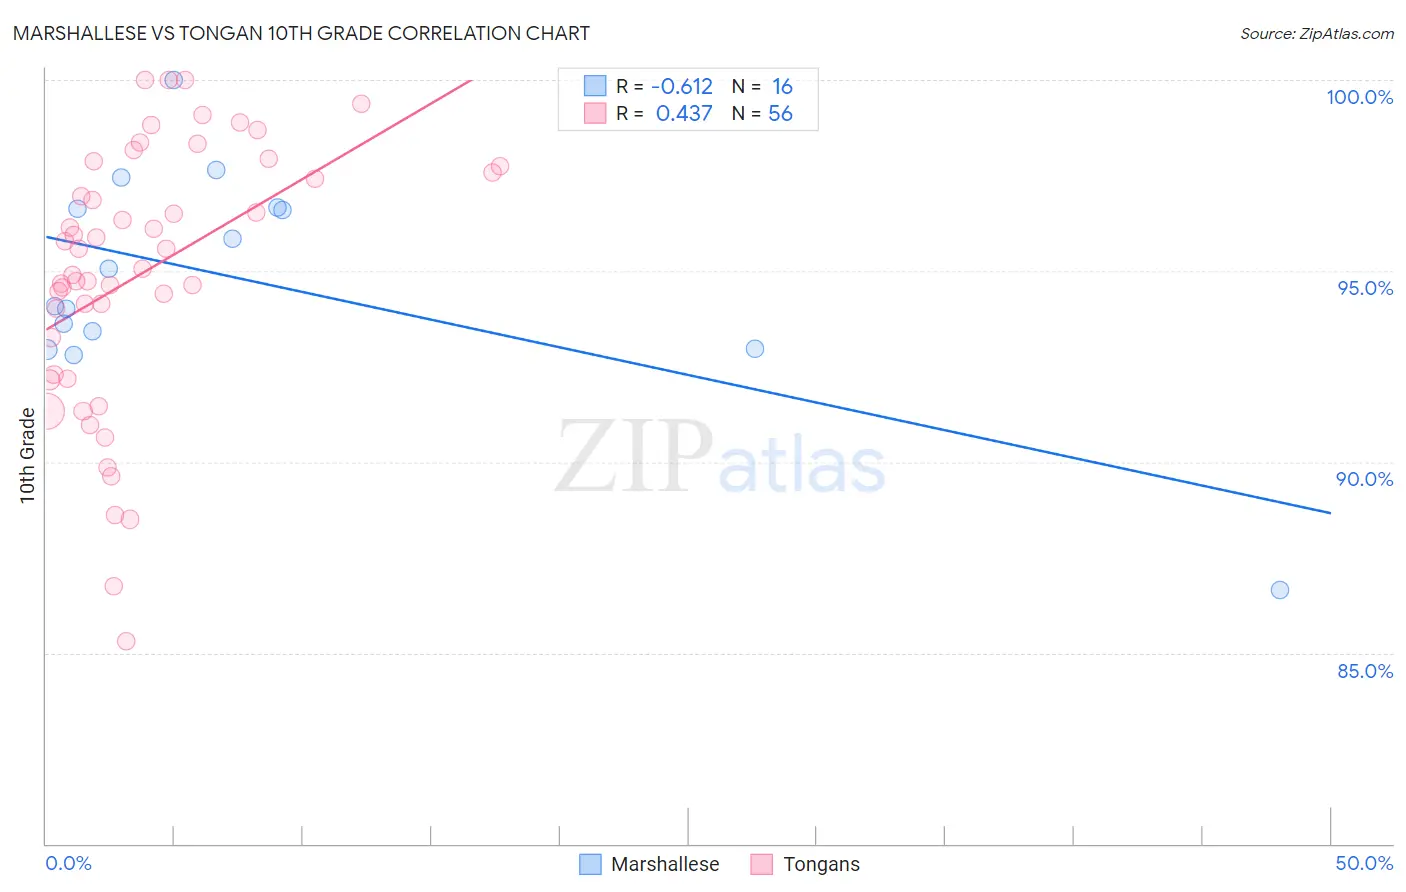
Marshallese vs Tongan 10th Grade Correlation Chart
The statistical analysis conducted on geographies consisting of 14,761,315 people shows a significant negative correlation between the proportion of Marshallese and percentage of population with at least 10th grade education in the United States with a correlation coefficient (R) of -0.612 and weighted average of 93.6%. Similarly, the statistical analysis conducted on geographies consisting of 102,873,790 people shows a moderate positive correlation between the proportion of Tongans and percentage of population with at least 10th grade education in the United States with a correlation coefficient (R) of 0.437 and weighted average of 93.3%, a difference of 0.35%.
10th Grade Correlation Summary
| Measurement | Marshallese | Tongan |
| Minimum | 86.6% | 85.3% |
| Maximum | 100.0% | 100.0% |
| Range | 13.4% | 14.7% |
| Mean | 94.8% | 94.9% |
| Median | 94.6% | 95.3% |
| Interquartile 25% (IQ1) | 93.2% | 92.8% |
| Interquartile 75% (IQ3) | 96.6% | 97.7% |
| Interquartile Range (IQR) | 3.4% | 4.9% |
| Standard Deviation (Sample) | 3.0% | 3.4% |
| Standard Deviation (Population) | 2.9% | 3.4% |
Similar Demographics by 10th Grade
Demographics Similar to Marshallese by 10th Grade
In terms of 10th grade, the demographic groups most similar to Marshallese are Immigrants from Pakistan (93.6%, a difference of 0.010%), Laotian (93.6%, a difference of 0.010%), Immigrants from Eastern Asia (93.6%, a difference of 0.020%), Liberian (93.6%, a difference of 0.020%), and Yup'ik (93.6%, a difference of 0.020%).
| Demographics | Rating | Rank | 10th Grade |
| Immigrants | Northern Africa | 41.6 /100 | #181 | Average 93.7% |
| Colville | 38.8 /100 | #182 | Fair 93.6% |
| Guamanians/Chamorros | 37.1 /100 | #183 | Fair 93.6% |
| Choctaw | 36.6 /100 | #184 | Fair 93.6% |
| Sudanese | 36.6 /100 | #185 | Fair 93.6% |
| Immigrants | Eastern Asia | 35.1 /100 | #186 | Fair 93.6% |
| Liberians | 34.7 /100 | #187 | Fair 93.6% |
| Marshallese | 33.2 /100 | #188 | Fair 93.6% |
| Immigrants | Pakistan | 32.5 /100 | #189 | Fair 93.6% |
| Laotians | 32.1 /100 | #190 | Fair 93.6% |
| Yup'ik | 31.1 /100 | #191 | Fair 93.6% |
| Immigrants | Malaysia | 28.0 /100 | #192 | Fair 93.5% |
| Panamanians | 28.0 /100 | #193 | Fair 93.5% |
| Immigrants | Morocco | 26.9 /100 | #194 | Fair 93.5% |
| Cheyenne | 26.8 /100 | #195 | Fair 93.5% |
Demographics Similar to Tongans by 10th Grade
In terms of 10th grade, the demographic groups most similar to Tongans are Immigrants from Liberia (93.3%, a difference of 0.020%), Seminole (93.3%, a difference of 0.020%), Immigrants from Southern Europe (93.2%, a difference of 0.020%), Ethiopian (93.2%, a difference of 0.050%), and Immigrants from Sierra Leone (93.2%, a difference of 0.050%).
| Demographics | Rating | Rank | 10th Grade |
| Immigrants | Asia | 15.7 /100 | #213 | Poor 93.4% |
| Immigrants | Bahamas | 15.2 /100 | #214 | Poor 93.4% |
| Immigrants | Oceania | 15.1 /100 | #215 | Poor 93.4% |
| Immigrants | Eastern Africa | 14.7 /100 | #216 | Poor 93.4% |
| Portuguese | 12.1 /100 | #217 | Poor 93.3% |
| Immigrants | Liberia | 10.2 /100 | #218 | Poor 93.3% |
| Seminole | 10.2 /100 | #219 | Poor 93.3% |
| Tongans | 9.5 /100 | #220 | Tragic 93.3% |
| Immigrants | Southern Europe | 8.9 /100 | #221 | Tragic 93.2% |
| Ethiopians | 7.9 /100 | #222 | Tragic 93.2% |
| Immigrants | Sierra Leone | 7.6 /100 | #223 | Tragic 93.2% |
| Bolivians | 6.7 /100 | #224 | Tragic 93.2% |
| Somalis | 6.2 /100 | #225 | Tragic 93.2% |
| Koreans | 6.1 /100 | #226 | Tragic 93.2% |
| Blacks/African Americans | 6.0 /100 | #227 | Tragic 93.2% |