Northern European vs Immigrants from Taiwan 9th Grade
COMPARE
Northern European
Immigrants from Taiwan
9th Grade
9th Grade Comparison
Northern Europeans
Immigrants from Taiwan
96.2%
9TH GRADE
99.9/ 100
METRIC RATING
36th/ 347
METRIC RANK
95.2%
9TH GRADE
85.3/ 100
METRIC RATING
140th/ 347
METRIC RANK
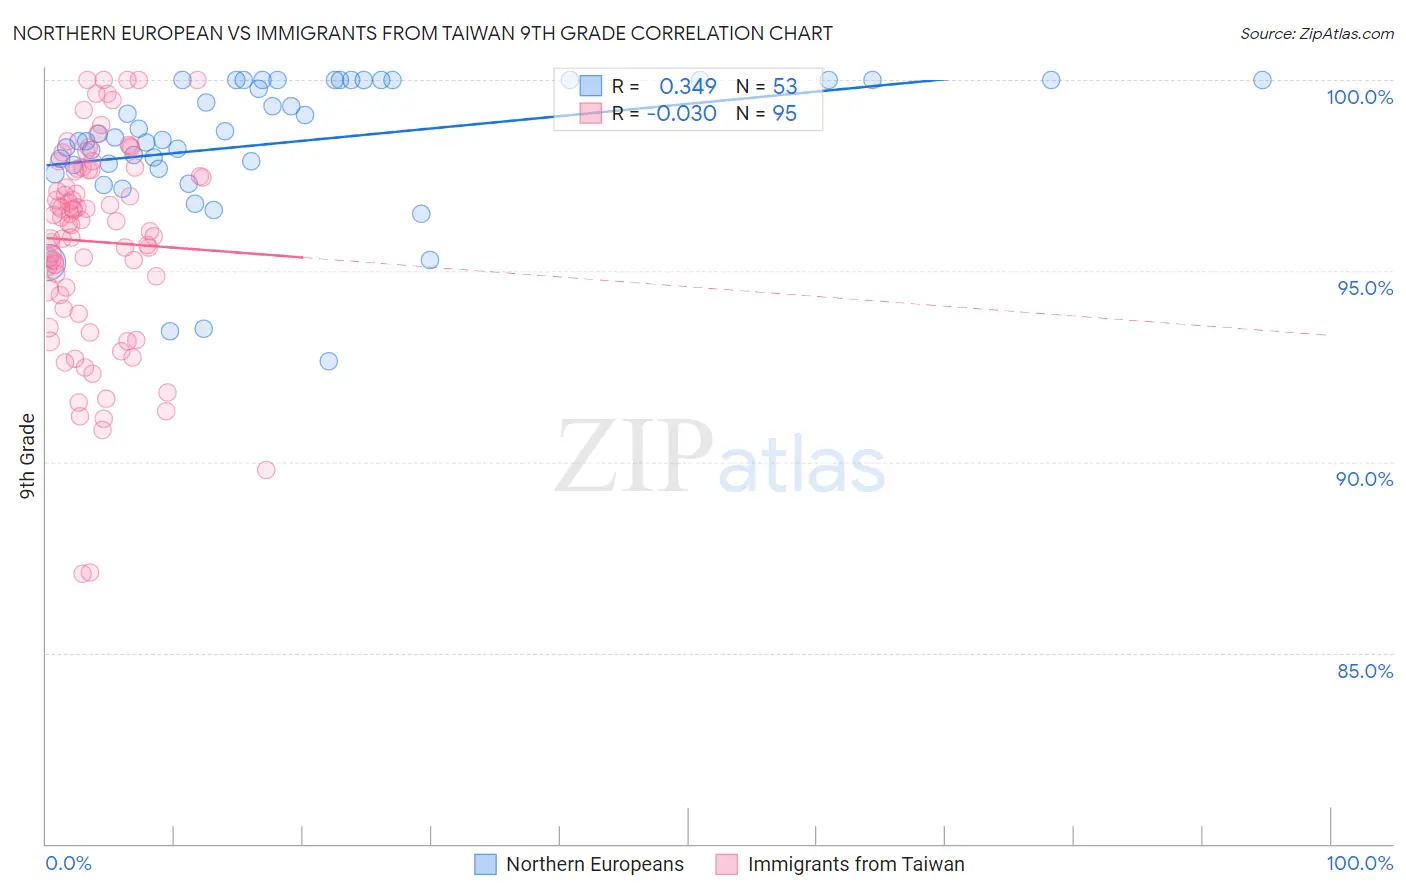
Northern European vs Immigrants from Taiwan 9th Grade Correlation Chart
The statistical analysis conducted on geographies consisting of 406,096,351 people shows a mild positive correlation between the proportion of Northern Europeans and percentage of population with at least 9th grade education in the United States with a correlation coefficient (R) of 0.349 and weighted average of 96.2%. Similarly, the statistical analysis conducted on geographies consisting of 298,292,402 people shows no correlation between the proportion of Immigrants from Taiwan and percentage of population with at least 9th grade education in the United States with a correlation coefficient (R) of -0.030 and weighted average of 95.2%, a difference of 1.1%.
9th Grade Correlation Summary
| Measurement | Northern European | Immigrants from Taiwan |
| Minimum | 92.6% | 87.1% |
| Maximum | 100.0% | 100.0% |
| Range | 7.4% | 12.9% |
| Mean | 98.4% | 95.8% |
| Median | 98.5% | 96.3% |
| Interquartile 25% (IQ1) | 97.7% | 94.4% |
| Interquartile 75% (IQ3) | 100.0% | 97.6% |
| Interquartile Range (IQR) | 2.3% | 3.3% |
| Standard Deviation (Sample) | 1.8% | 2.7% |
| Standard Deviation (Population) | 1.8% | 2.7% |
Similar Demographics by 9th Grade
Demographics Similar to Northern Europeans by 9th Grade
In terms of 9th grade, the demographic groups most similar to Northern Europeans are Bulgarian (96.2%, a difference of 0.010%), Hungarian (96.2%, a difference of 0.040%), Estonian (96.1%, a difference of 0.040%), Immigrants from Scotland (96.1%, a difference of 0.040%), and Ottawa (96.1%, a difference of 0.060%).
| Demographics | Rating | Rank | 9th Grade |
| Chinese | 100.0 /100 | #29 | Exceptional 96.3% |
| Maltese | 100.0 /100 | #30 | Exceptional 96.3% |
| British | 100.0 /100 | #31 | Exceptional 96.3% |
| Belgians | 100.0 /100 | #32 | Exceptional 96.3% |
| Luxembourgers | 100.0 /100 | #33 | Exceptional 96.3% |
| Hungarians | 100.0 /100 | #34 | Exceptional 96.2% |
| Bulgarians | 99.9 /100 | #35 | Exceptional 96.2% |
| Northern Europeans | 99.9 /100 | #36 | Exceptional 96.2% |
| Estonians | 99.9 /100 | #37 | Exceptional 96.1% |
| Immigrants | Scotland | 99.9 /100 | #38 | Exceptional 96.1% |
| Ottawa | 99.9 /100 | #39 | Exceptional 96.1% |
| Slavs | 99.9 /100 | #40 | Exceptional 96.1% |
| Czechoslovakians | 99.9 /100 | #41 | Exceptional 96.1% |
| Chippewa | 99.9 /100 | #42 | Exceptional 96.1% |
| Iranians | 99.9 /100 | #43 | Exceptional 96.1% |
Demographics Similar to Immigrants from Taiwan by 9th Grade
In terms of 9th grade, the demographic groups most similar to Immigrants from Taiwan are Immigrants from Bosnia and Herzegovina (95.2%, a difference of 0.0%), Immigrants from Eastern Europe (95.2%, a difference of 0.010%), Immigrants from Greece (95.2%, a difference of 0.010%), Spanish (95.2%, a difference of 0.010%), and Immigrants from Russia (95.2%, a difference of 0.020%).
| Demographics | Rating | Rank | 9th Grade |
| Israelis | 90.4 /100 | #133 | Exceptional 95.3% |
| Immigrants | Israel | 89.6 /100 | #134 | Excellent 95.3% |
| Immigrants | Belarus | 88.9 /100 | #135 | Excellent 95.2% |
| Immigrants | Iran | 88.3 /100 | #136 | Excellent 95.2% |
| Hmong | 87.7 /100 | #137 | Excellent 95.2% |
| Immigrants | Russia | 86.6 /100 | #138 | Excellent 95.2% |
| Immigrants | Eastern Europe | 85.8 /100 | #139 | Excellent 95.2% |
| Immigrants | Taiwan | 85.3 /100 | #140 | Excellent 95.2% |
| Immigrants | Bosnia and Herzegovina | 85.2 /100 | #141 | Excellent 95.2% |
| Immigrants | Greece | 84.6 /100 | #142 | Excellent 95.2% |
| Spanish | 84.4 /100 | #143 | Excellent 95.2% |
| Yup'ik | 83.3 /100 | #144 | Excellent 95.2% |
| Pueblo | 82.2 /100 | #145 | Excellent 95.1% |
| Immigrants | Sri Lanka | 82.1 /100 | #146 | Excellent 95.1% |
| Choctaw | 81.9 /100 | #147 | Excellent 95.1% |