Immigrants from Italy vs Immigrants from Taiwan 9th Grade
COMPARE
Immigrants from Italy
Immigrants from Taiwan
9th Grade
9th Grade Comparison
Immigrants from Italy
Immigrants from Taiwan
95.0%
9TH GRADE
66.6/ 100
METRIC RATING
160th/ 347
METRIC RANK
95.2%
9TH GRADE
85.3/ 100
METRIC RATING
140th/ 347
METRIC RANK
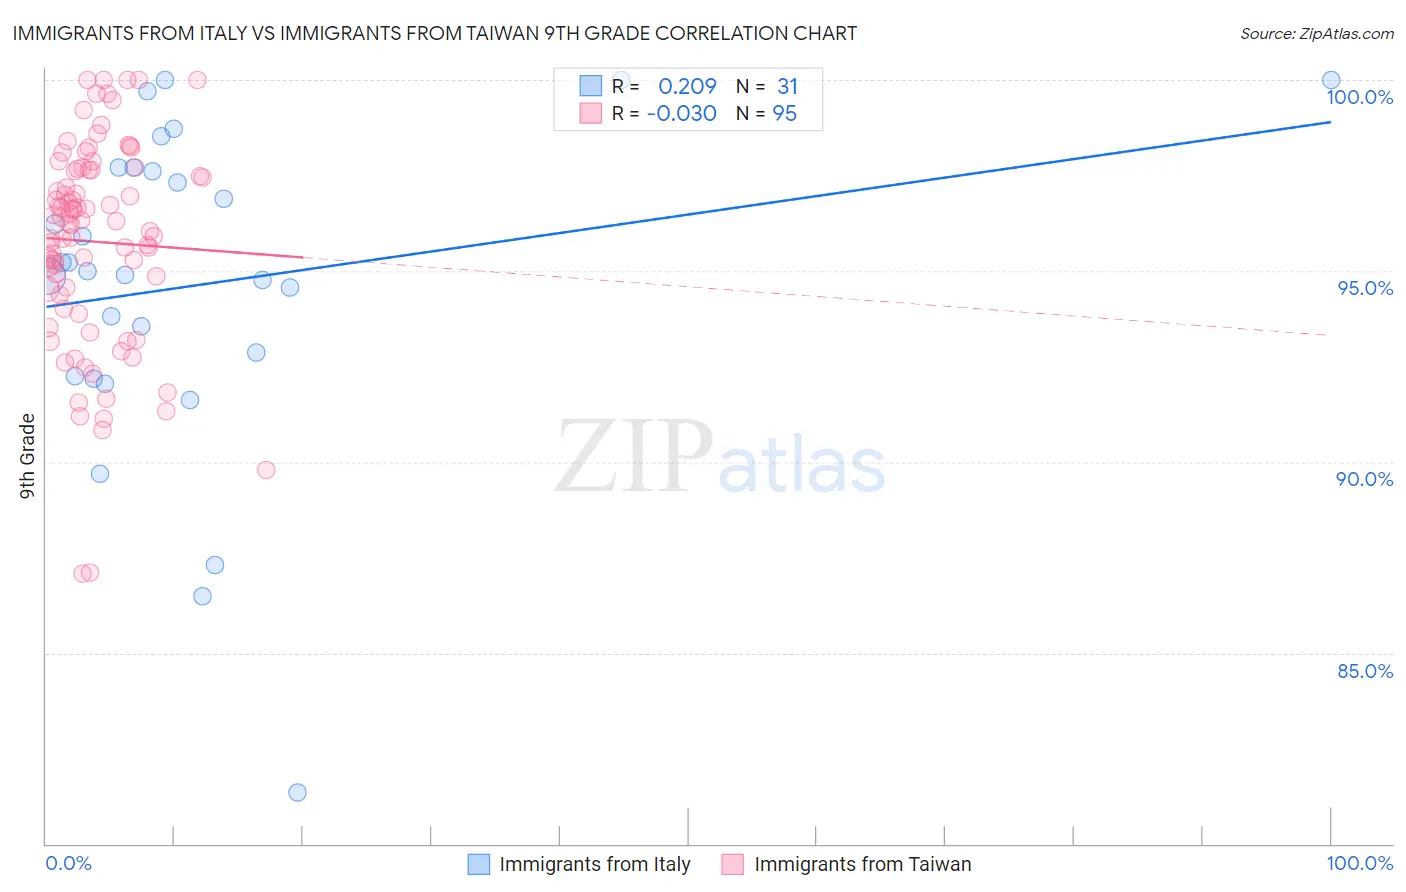
Immigrants from Italy vs Immigrants from Taiwan 9th Grade Correlation Chart
The statistical analysis conducted on geographies consisting of 324,225,686 people shows a weak positive correlation between the proportion of Immigrants from Italy and percentage of population with at least 9th grade education in the United States with a correlation coefficient (R) of 0.209 and weighted average of 95.0%. Similarly, the statistical analysis conducted on geographies consisting of 298,292,402 people shows no correlation between the proportion of Immigrants from Taiwan and percentage of population with at least 9th grade education in the United States with a correlation coefficient (R) of -0.030 and weighted average of 95.2%, a difference of 0.20%.
9th Grade Correlation Summary
| Measurement | Immigrants from Italy | Immigrants from Taiwan |
| Minimum | 81.3% | 87.1% |
| Maximum | 100.0% | 100.0% |
| Range | 18.7% | 12.9% |
| Mean | 94.6% | 95.8% |
| Median | 95.0% | 96.3% |
| Interquartile 25% (IQ1) | 92.3% | 94.4% |
| Interquartile 75% (IQ3) | 97.7% | 97.6% |
| Interquartile Range (IQR) | 5.5% | 3.3% |
| Standard Deviation (Sample) | 4.3% | 2.7% |
| Standard Deviation (Population) | 4.2% | 2.7% |
Demographics Similar to Immigrants from Italy and Immigrants from Taiwan by 9th Grade
In terms of 9th grade, the demographic groups most similar to Immigrants from Italy are Immigrants from Ukraine (95.0%, a difference of 0.010%), Egyptian (95.0%, a difference of 0.030%), Immigrants from Kenya (95.0%, a difference of 0.060%), Mongolian (95.0%, a difference of 0.060%), and Arab (95.1%, a difference of 0.070%). Similarly, the demographic groups most similar to Immigrants from Taiwan are Immigrants from Bosnia and Herzegovina (95.2%, a difference of 0.0%), Immigrants from Greece (95.2%, a difference of 0.010%), Spanish (95.2%, a difference of 0.010%), Yup'ik (95.2%, a difference of 0.030%), and Pueblo (95.1%, a difference of 0.040%).
| Demographics | Rating | Rank | 9th Grade |
| Immigrants | Taiwan | 85.3 /100 | #140 | Excellent 95.2% |
| Immigrants | Bosnia and Herzegovina | 85.2 /100 | #141 | Excellent 95.2% |
| Immigrants | Greece | 84.6 /100 | #142 | Excellent 95.2% |
| Spanish | 84.4 /100 | #143 | Excellent 95.2% |
| Yup'ik | 83.3 /100 | #144 | Excellent 95.2% |
| Pueblo | 82.2 /100 | #145 | Excellent 95.1% |
| Immigrants | Sri Lanka | 82.1 /100 | #146 | Excellent 95.1% |
| Choctaw | 81.9 /100 | #147 | Excellent 95.1% |
| Immigrants | Jordan | 81.2 /100 | #148 | Excellent 95.1% |
| Immigrants | Korea | 79.6 /100 | #149 | Good 95.1% |
| Kenyans | 79.1 /100 | #150 | Good 95.1% |
| Cajuns | 77.3 /100 | #151 | Good 95.1% |
| Ugandans | 77.0 /100 | #152 | Good 95.1% |
| Albanians | 76.1 /100 | #153 | Good 95.1% |
| Arabs | 74.9 /100 | #154 | Good 95.1% |
| Immigrants | Kazakhstan | 74.7 /100 | #155 | Good 95.1% |
| Immigrants | Kenya | 73.1 /100 | #156 | Good 95.0% |
| Mongolians | 73.0 /100 | #157 | Good 95.0% |
| Egyptians | 70.1 /100 | #158 | Good 95.0% |
| Immigrants | Ukraine | 67.4 /100 | #159 | Good 95.0% |
| Immigrants | Italy | 66.6 /100 | #160 | Good 95.0% |