Marshallese vs Irish 7th Grade
COMPARE
Marshallese
Irish
7th Grade
7th Grade Comparison
Marshallese
Irish
96.0%
7TH GRADE
48.4/ 100
METRIC RATING
178th/ 347
METRIC RANK
97.5%
7TH GRADE
100.0/ 100
METRIC RATING
16th/ 347
METRIC RANK
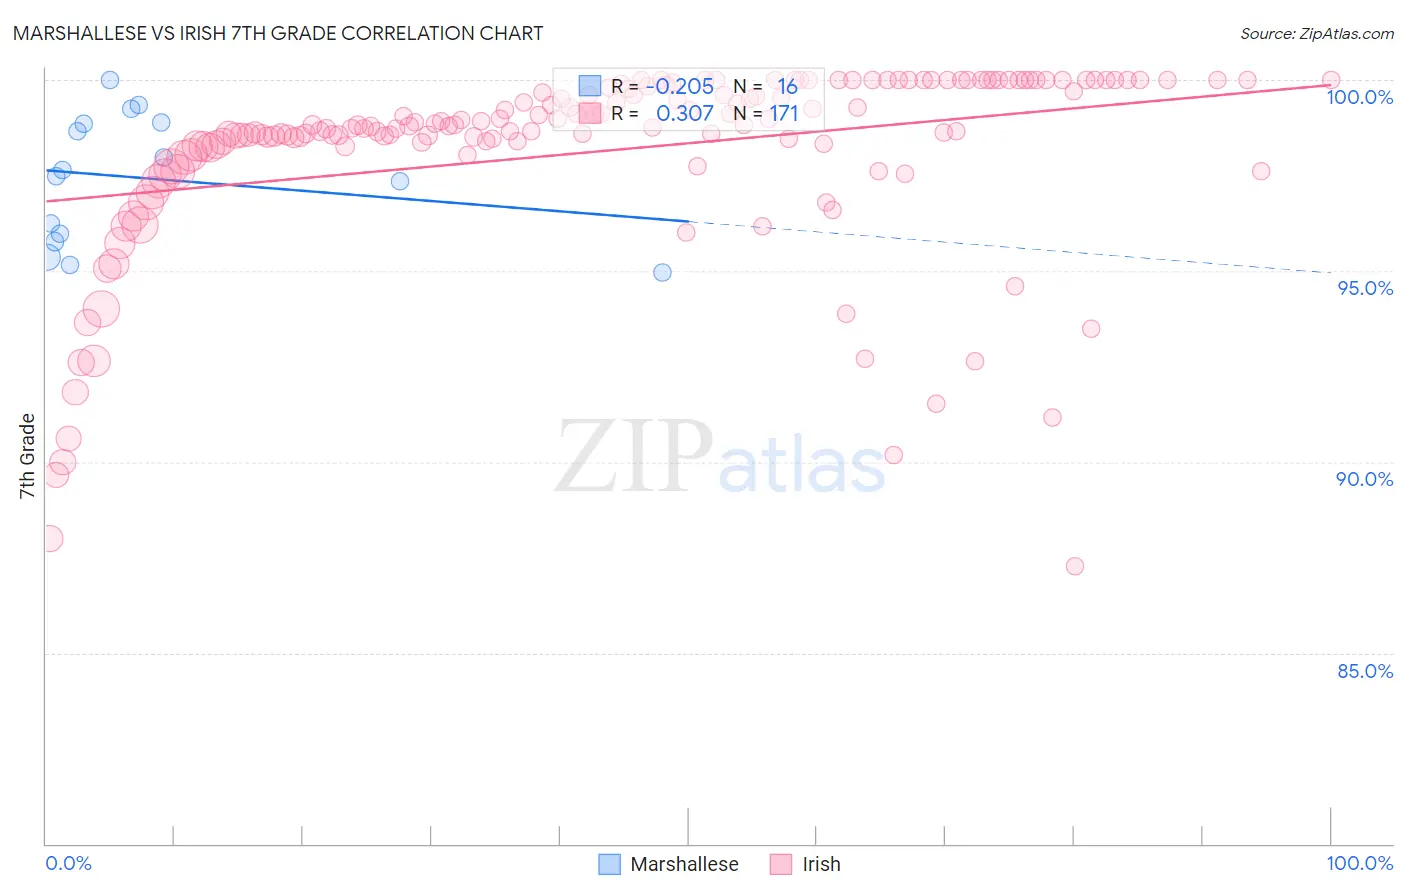
Marshallese vs Irish 7th Grade Correlation Chart
The statistical analysis conducted on geographies consisting of 14,761,315 people shows a weak negative correlation between the proportion of Marshallese and percentage of population with at least 7th grade education in the United States with a correlation coefficient (R) of -0.205 and weighted average of 96.0%. Similarly, the statistical analysis conducted on geographies consisting of 580,710,695 people shows a mild positive correlation between the proportion of Irish and percentage of population with at least 7th grade education in the United States with a correlation coefficient (R) of 0.307 and weighted average of 97.5%, a difference of 1.5%.
7th Grade Correlation Summary
| Measurement | Marshallese | Irish |
| Minimum | 94.9% | 87.3% |
| Maximum | 100.0% | 100.0% |
| Range | 5.1% | 12.7% |
| Mean | 97.4% | 98.1% |
| Median | 97.6% | 98.8% |
| Interquartile 25% (IQ1) | 95.9% | 98.3% |
| Interquartile 75% (IQ3) | 98.9% | 99.9% |
| Interquartile Range (IQR) | 3.0% | 1.6% |
| Standard Deviation (Sample) | 1.7% | 2.5% |
| Standard Deviation (Population) | 1.6% | 2.5% |
Similar Demographics by 7th Grade
Demographics Similar to Marshallese by 7th Grade
In terms of 7th grade, the demographic groups most similar to Marshallese are Immigrants from Korea (96.0%, a difference of 0.0%), Immigrants from Iran (96.0%, a difference of 0.0%), Immigrants from Albania (96.0%, a difference of 0.010%), Mongolian (96.0%, a difference of 0.010%), and Black/African American (96.0%, a difference of 0.010%).
| Demographics | Rating | Rank | 7th Grade |
| Egyptians | 54.2 /100 | #171 | Average 96.1% |
| Venezuelans | 51.4 /100 | #172 | Average 96.0% |
| Immigrants | Albania | 50.4 /100 | #173 | Average 96.0% |
| Mongolians | 50.0 /100 | #174 | Average 96.0% |
| Blacks/African Americans | 49.5 /100 | #175 | Average 96.0% |
| Chileans | 49.3 /100 | #176 | Average 96.0% |
| Immigrants | Korea | 49.2 /100 | #177 | Average 96.0% |
| Marshallese | 48.4 /100 | #178 | Average 96.0% |
| Immigrants | Iran | 47.8 /100 | #179 | Average 96.0% |
| Immigrants | Brazil | 46.8 /100 | #180 | Average 96.0% |
| Pakistanis | 44.5 /100 | #181 | Average 96.0% |
| Iraqis | 41.2 /100 | #182 | Average 96.0% |
| Immigrants | Spain | 38.8 /100 | #183 | Fair 96.0% |
| Sierra Leoneans | 37.5 /100 | #184 | Fair 96.0% |
| Brazilians | 37.3 /100 | #185 | Fair 96.0% |
Demographics Similar to Irish by 7th Grade
In terms of 7th grade, the demographic groups most similar to Irish are Scottish (97.5%, a difference of 0.010%), Tlingit-Haida (97.5%, a difference of 0.020%), Lithuanian (97.5%, a difference of 0.030%), English (97.6%, a difference of 0.060%), and Pennsylvania German (97.6%, a difference of 0.070%).
| Demographics | Rating | Rank | 7th Grade |
| Germans | 100.0 /100 | #9 | Exceptional 97.7% |
| Slovenes | 100.0 /100 | #10 | Exceptional 97.6% |
| Alaskan Athabascans | 100.0 /100 | #11 | Exceptional 97.6% |
| Poles | 100.0 /100 | #12 | Exceptional 97.6% |
| Swedes | 100.0 /100 | #13 | Exceptional 97.6% |
| Pennsylvania Germans | 100.0 /100 | #14 | Exceptional 97.6% |
| English | 100.0 /100 | #15 | Exceptional 97.6% |
| Irish | 100.0 /100 | #16 | Exceptional 97.5% |
| Scottish | 100.0 /100 | #17 | Exceptional 97.5% |
| Tlingit-Haida | 100.0 /100 | #18 | Exceptional 97.5% |
| Lithuanians | 100.0 /100 | #19 | Exceptional 97.5% |
| Yup'ik | 100.0 /100 | #20 | Exceptional 97.4% |
| Inupiat | 100.0 /100 | #21 | Exceptional 97.4% |
| French Canadians | 100.0 /100 | #22 | Exceptional 97.4% |
| Croatians | 100.0 /100 | #23 | Exceptional 97.4% |