Immigrants from Egypt vs Immigrants from Yemen Doctorate Degree
COMPARE
Immigrants from Egypt
Immigrants from Yemen
Doctorate Degree
Doctorate Degree Comparison
Immigrants from Egypt
Immigrants from Yemen
2.1%
DOCTORATE DEGREE
98.2/ 100
METRIC RATING
99th/ 347
METRIC RANK
1.4%
DOCTORATE DEGREE
0.2/ 100
METRIC RATING
293rd/ 347
METRIC RANK
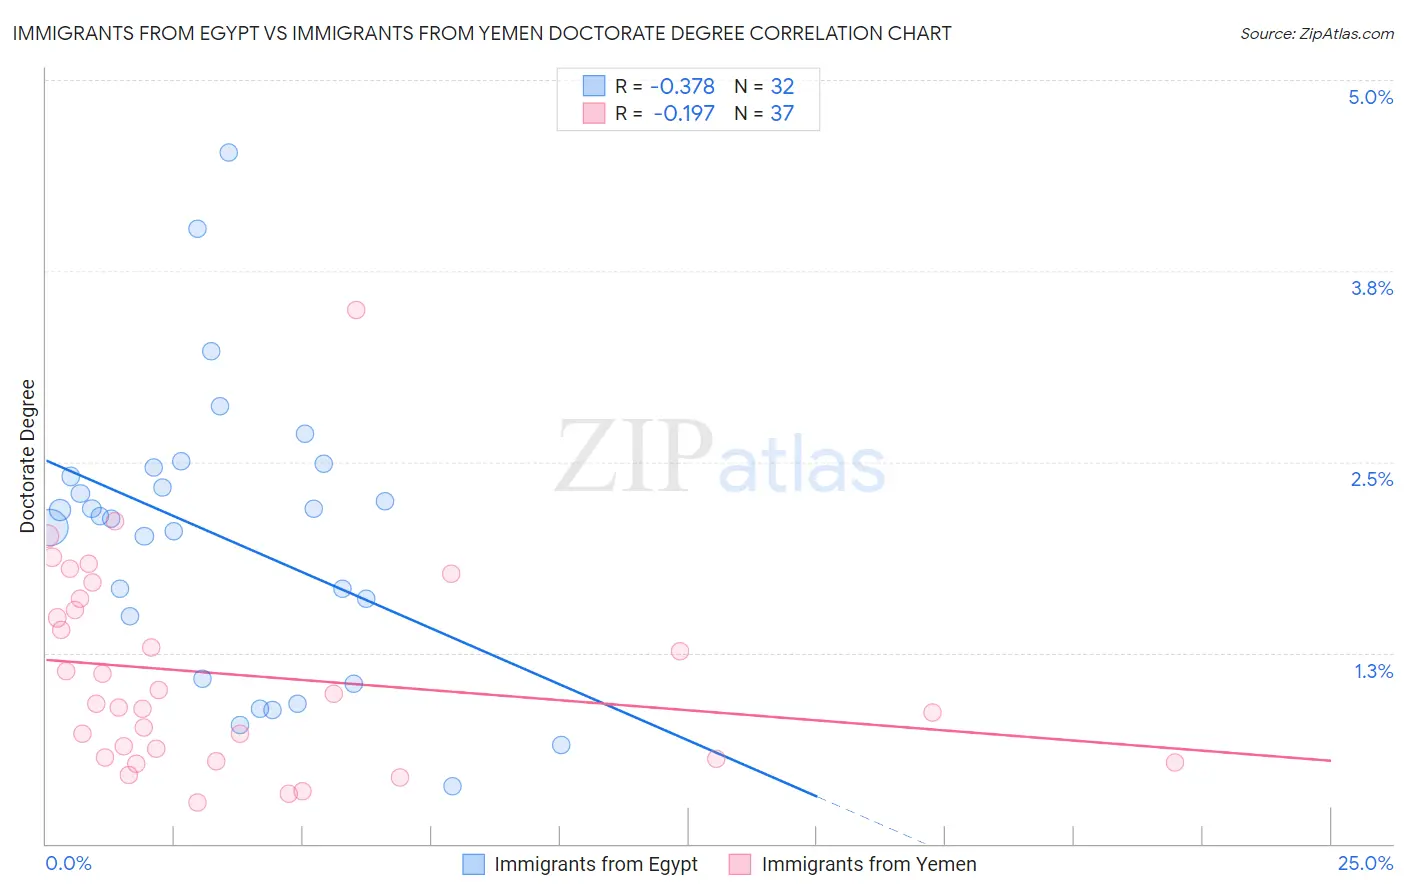
Immigrants from Egypt vs Immigrants from Yemen Doctorate Degree Correlation Chart
The statistical analysis conducted on geographies consisting of 244,806,007 people shows a mild negative correlation between the proportion of Immigrants from Egypt and percentage of population with at least doctorate degree education in the United States with a correlation coefficient (R) of -0.378 and weighted average of 2.1%. Similarly, the statistical analysis conducted on geographies consisting of 82,189,372 people shows a poor negative correlation between the proportion of Immigrants from Yemen and percentage of population with at least doctorate degree education in the United States with a correlation coefficient (R) of -0.197 and weighted average of 1.4%, a difference of 47.4%.
Doctorate Degree Correlation Summary
| Measurement | Immigrants from Egypt | Immigrants from Yemen |
| Minimum | 0.38% | 0.27% |
| Maximum | 4.5% | 3.5% |
| Range | 4.1% | 3.2% |
| Mean | 2.0% | 1.1% |
| Median | 2.1% | 0.91% |
| Interquartile 25% (IQ1) | 1.3% | 0.56% |
| Interquartile 75% (IQ3) | 2.4% | 1.6% |
| Interquartile Range (IQR) | 1.1% | 1.0% |
| Standard Deviation (Sample) | 0.92% | 0.67% |
| Standard Deviation (Population) | 0.91% | 0.66% |
Similar Demographics by Doctorate Degree
Demographics Similar to Immigrants from Egypt by Doctorate Degree
In terms of doctorate degree, the demographic groups most similar to Immigrants from Egypt are Immigrants from Eastern Europe (2.1%, a difference of 0.0%), Immigrants from Eastern Africa (2.1%, a difference of 0.030%), Armenian (2.1%, a difference of 0.18%), Immigrants from Chile (2.1%, a difference of 0.25%), and Immigrants from Eritrea (2.1%, a difference of 0.26%).
| Demographics | Rating | Rank | Doctorate Degree |
| Chileans | 99.1 /100 | #92 | Exceptional 2.2% |
| Alsatians | 99.0 /100 | #93 | Exceptional 2.1% |
| Greeks | 98.8 /100 | #94 | Exceptional 2.1% |
| Immigrants | Romania | 98.7 /100 | #95 | Exceptional 2.1% |
| Immigrants | Northern Africa | 98.4 /100 | #96 | Exceptional 2.1% |
| Immigrants | Eritrea | 98.4 /100 | #97 | Exceptional 2.1% |
| Armenians | 98.3 /100 | #98 | Exceptional 2.1% |
| Immigrants | Egypt | 98.2 /100 | #99 | Exceptional 2.1% |
| Immigrants | Eastern Europe | 98.2 /100 | #100 | Exceptional 2.1% |
| Immigrants | Eastern Africa | 98.2 /100 | #101 | Exceptional 2.1% |
| Immigrants | Chile | 98.1 /100 | #102 | Exceptional 2.1% |
| Romanians | 98.1 /100 | #103 | Exceptional 2.1% |
| Austrians | 98.0 /100 | #104 | Exceptional 2.1% |
| Arabs | 97.8 /100 | #105 | Exceptional 2.1% |
| Sudanese | 97.7 /100 | #106 | Exceptional 2.1% |
Demographics Similar to Immigrants from Yemen by Doctorate Degree
In terms of doctorate degree, the demographic groups most similar to Immigrants from Yemen are Alaska Native (1.4%, a difference of 0.59%), Samoan (1.4%, a difference of 0.71%), Black/African American (1.4%, a difference of 0.76%), Choctaw (1.4%, a difference of 0.99%), and Cape Verdean (1.4%, a difference of 1.0%).
| Demographics | Rating | Rank | Doctorate Degree |
| Cherokee | 0.3 /100 | #286 | Tragic 1.5% |
| Cajuns | 0.3 /100 | #287 | Tragic 1.5% |
| Immigrants | El Salvador | 0.3 /100 | #288 | Tragic 1.4% |
| Cape Verdeans | 0.3 /100 | #289 | Tragic 1.4% |
| Choctaw | 0.3 /100 | #290 | Tragic 1.4% |
| Blacks/African Americans | 0.3 /100 | #291 | Tragic 1.4% |
| Alaska Natives | 0.3 /100 | #292 | Tragic 1.4% |
| Immigrants | Yemen | 0.2 /100 | #293 | Tragic 1.4% |
| Samoans | 0.2 /100 | #294 | Tragic 1.4% |
| Guatemalans | 0.2 /100 | #295 | Tragic 1.4% |
| Immigrants | Ecuador | 0.2 /100 | #296 | Tragic 1.4% |
| Tsimshian | 0.2 /100 | #297 | Tragic 1.4% |
| Puerto Ricans | 0.1 /100 | #298 | Tragic 1.4% |
| Belizeans | 0.1 /100 | #299 | Tragic 1.4% |
| Immigrants | Guatemala | 0.1 /100 | #300 | Tragic 1.4% |