Maltese vs Sri Lankan 10th Grade
COMPARE
Maltese
Sri Lankan
10th Grade
10th Grade Comparison
Maltese
Sri Lankans
95.5%
10TH GRADE
100.0/ 100
METRIC RATING
25th/ 347
METRIC RANK
91.8%
10TH GRADE
0.0/ 100
METRIC RATING
289th/ 347
METRIC RANK
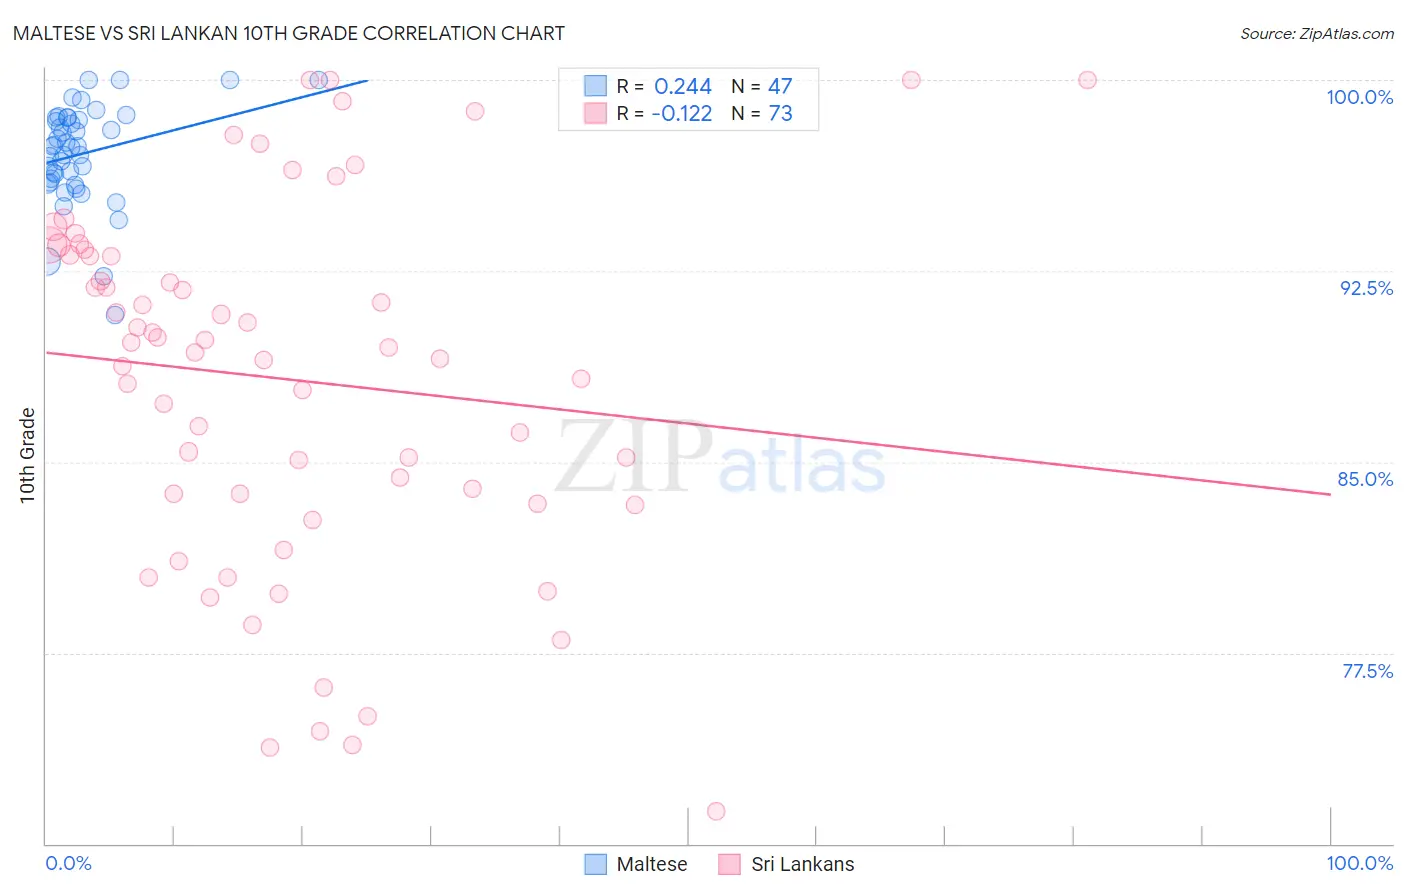
Maltese vs Sri Lankan 10th Grade Correlation Chart
The statistical analysis conducted on geographies consisting of 126,475,193 people shows a weak positive correlation between the proportion of Maltese and percentage of population with at least 10th grade education in the United States with a correlation coefficient (R) of 0.244 and weighted average of 95.5%. Similarly, the statistical analysis conducted on geographies consisting of 440,593,537 people shows a poor negative correlation between the proportion of Sri Lankans and percentage of population with at least 10th grade education in the United States with a correlation coefficient (R) of -0.122 and weighted average of 91.8%, a difference of 3.9%.
10th Grade Correlation Summary
| Measurement | Maltese | Sri Lankan |
| Minimum | 90.8% | 71.3% |
| Maximum | 100.0% | 100.0% |
| Range | 9.2% | 28.7% |
| Mean | 97.1% | 88.2% |
| Median | 97.4% | 89.5% |
| Interquartile 25% (IQ1) | 96.0% | 83.6% |
| Interquartile 75% (IQ3) | 98.5% | 93.2% |
| Interquartile Range (IQR) | 2.6% | 9.7% |
| Standard Deviation (Sample) | 2.0% | 7.1% |
| Standard Deviation (Population) | 1.9% | 7.0% |
Similar Demographics by 10th Grade
Demographics Similar to Maltese by 10th Grade
In terms of 10th grade, the demographic groups most similar to Maltese are European (95.5%, a difference of 0.0%), Czech (95.5%, a difference of 0.020%), Welsh (95.5%, a difference of 0.020%), Eastern European (95.5%, a difference of 0.030%), and Alaskan Athabascan (95.4%, a difference of 0.040%).
| Demographics | Rating | Rank | 10th Grade |
| Italians | 100.0 /100 | #18 | Exceptional 95.6% |
| Scandinavians | 100.0 /100 | #19 | Exceptional 95.6% |
| Chinese | 100.0 /100 | #20 | Exceptional 95.5% |
| Dutch | 100.0 /100 | #21 | Exceptional 95.5% |
| Eastern Europeans | 100.0 /100 | #22 | Exceptional 95.5% |
| Czechs | 100.0 /100 | #23 | Exceptional 95.5% |
| Europeans | 100.0 /100 | #24 | Exceptional 95.5% |
| Maltese | 100.0 /100 | #25 | Exceptional 95.5% |
| Welsh | 100.0 /100 | #26 | Exceptional 95.5% |
| Alaskan Athabascans | 100.0 /100 | #27 | Exceptional 95.4% |
| Luxembourgers | 100.0 /100 | #28 | Exceptional 95.4% |
| Bulgarians | 100.0 /100 | #29 | Exceptional 95.4% |
| Belgians | 100.0 /100 | #30 | Exceptional 95.4% |
| Iranians | 100.0 /100 | #31 | Exceptional 95.3% |
| Hungarians | 100.0 /100 | #32 | Exceptional 95.3% |
Demographics Similar to Sri Lankans by 10th Grade
In terms of 10th grade, the demographic groups most similar to Sri Lankans are British West Indian (91.8%, a difference of 0.020%), Immigrants from West Indies (91.8%, a difference of 0.030%), Immigrants from Burma/Myanmar (91.8%, a difference of 0.030%), Pennsylvania German (91.9%, a difference of 0.040%), and Immigrants from Laos (91.9%, a difference of 0.040%).
| Demographics | Rating | Rank | 10th Grade |
| Immigrants | Peru | 0.1 /100 | #282 | Tragic 92.2% |
| Immigrants | St. Vincent and the Grenadines | 0.0 /100 | #283 | Tragic 92.1% |
| Immigrants | Barbados | 0.0 /100 | #284 | Tragic 92.1% |
| Immigrants | South Eastern Asia | 0.0 /100 | #285 | Tragic 92.1% |
| Yuman | 0.0 /100 | #286 | Tragic 92.0% |
| Pennsylvania Germans | 0.0 /100 | #287 | Tragic 91.9% |
| Immigrants | Laos | 0.0 /100 | #288 | Tragic 91.9% |
| Sri Lankans | 0.0 /100 | #289 | Tragic 91.8% |
| British West Indians | 0.0 /100 | #290 | Tragic 91.8% |
| Immigrants | West Indies | 0.0 /100 | #291 | Tragic 91.8% |
| Immigrants | Burma/Myanmar | 0.0 /100 | #292 | Tragic 91.8% |
| Indonesians | 0.0 /100 | #293 | Tragic 91.8% |
| Haitians | 0.0 /100 | #294 | Tragic 91.8% |
| Lumbee | 0.0 /100 | #295 | Tragic 91.7% |
| Immigrants | Grenada | 0.0 /100 | #296 | Tragic 91.6% |