Maltese vs U.S. Virgin Islander 7th Grade
COMPARE
Maltese
U.S. Virgin Islander
7th Grade
7th Grade Comparison
Maltese
U.S. Virgin Islanders
97.1%
7TH GRADE
99.9/ 100
METRIC RATING
43rd/ 347
METRIC RANK
95.4%
7TH GRADE
1.6/ 100
METRIC RATING
243rd/ 347
METRIC RANK
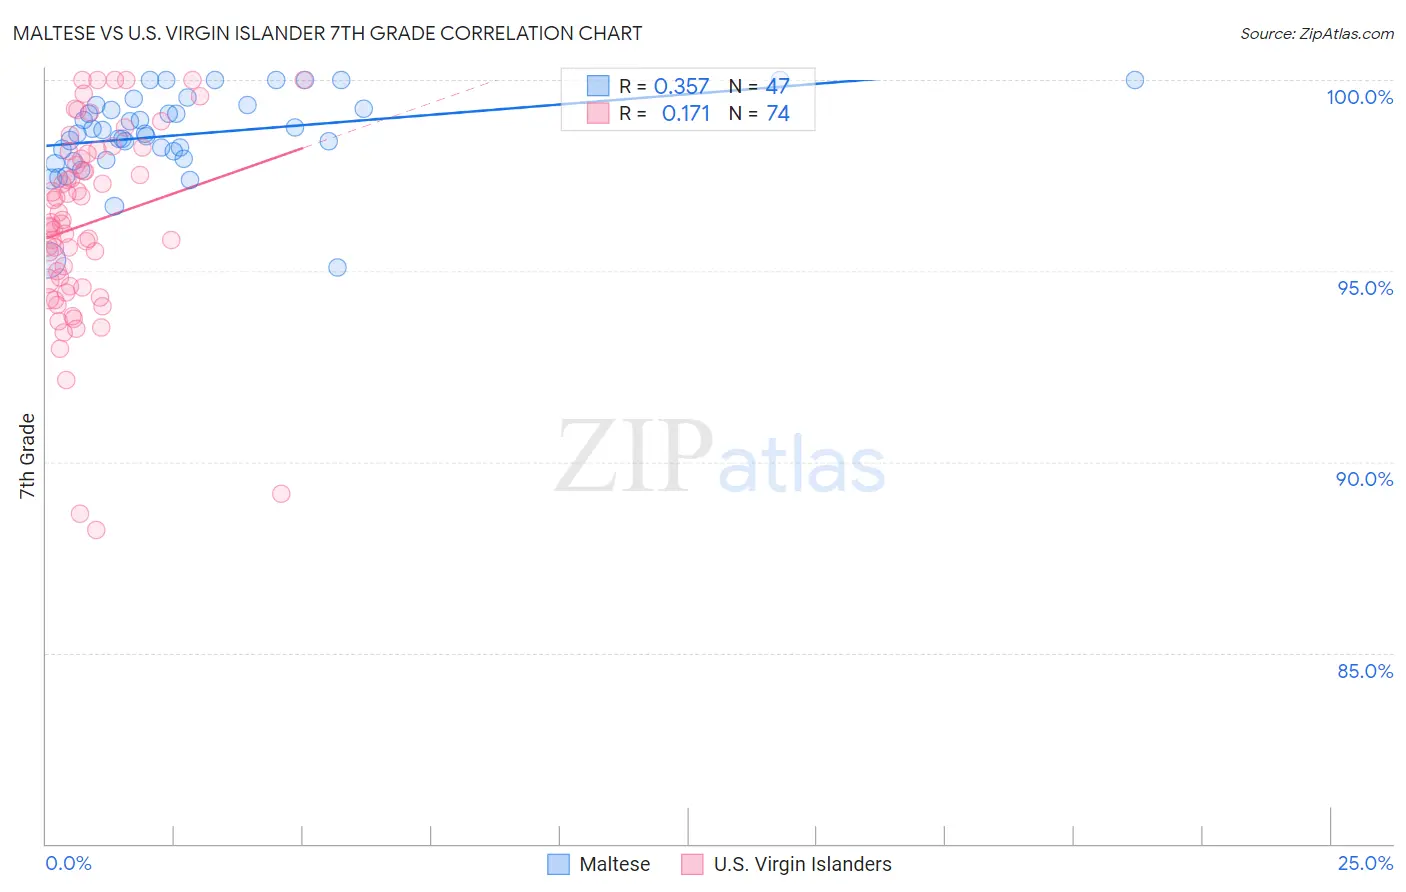
Maltese vs U.S. Virgin Islander 7th Grade Correlation Chart
The statistical analysis conducted on geographies consisting of 126,476,608 people shows a mild positive correlation between the proportion of Maltese and percentage of population with at least 7th grade education in the United States with a correlation coefficient (R) of 0.357 and weighted average of 97.1%. Similarly, the statistical analysis conducted on geographies consisting of 87,529,315 people shows a poor positive correlation between the proportion of U.S. Virgin Islanders and percentage of population with at least 7th grade education in the United States with a correlation coefficient (R) of 0.171 and weighted average of 95.4%, a difference of 1.8%.
7th Grade Correlation Summary
| Measurement | Maltese | U.S. Virgin Islander |
| Minimum | 95.1% | 88.2% |
| Maximum | 100.0% | 100.0% |
| Range | 4.9% | 11.8% |
| Mean | 98.6% | 96.2% |
| Median | 98.6% | 96.2% |
| Interquartile 25% (IQ1) | 97.9% | 94.6% |
| Interquartile 75% (IQ3) | 99.3% | 98.1% |
| Interquartile Range (IQR) | 1.4% | 3.5% |
| Standard Deviation (Sample) | 1.1% | 2.5% |
| Standard Deviation (Population) | 1.1% | 2.5% |
Similar Demographics by 7th Grade
Demographics Similar to Maltese by 7th Grade
In terms of 7th grade, the demographic groups most similar to Maltese are Northern European (97.1%, a difference of 0.0%), Czechoslovakian (97.1%, a difference of 0.010%), Aleut (97.1%, a difference of 0.010%), Chinese (97.1%, a difference of 0.030%), and Bulgarian (97.1%, a difference of 0.040%).
| Demographics | Rating | Rank | 7th Grade |
| Hungarians | 100.0 /100 | #36 | Exceptional 97.2% |
| British | 100.0 /100 | #37 | Exceptional 97.2% |
| Belgians | 100.0 /100 | #38 | Exceptional 97.2% |
| Latvians | 100.0 /100 | #39 | Exceptional 97.2% |
| Luxembourgers | 100.0 /100 | #40 | Exceptional 97.2% |
| Eastern Europeans | 100.0 /100 | #41 | Exceptional 97.2% |
| Chinese | 99.9 /100 | #42 | Exceptional 97.1% |
| Maltese | 99.9 /100 | #43 | Exceptional 97.1% |
| Northern Europeans | 99.9 /100 | #44 | Exceptional 97.1% |
| Czechoslovakians | 99.9 /100 | #45 | Exceptional 97.1% |
| Aleuts | 99.9 /100 | #46 | Exceptional 97.1% |
| Bulgarians | 99.9 /100 | #47 | Exceptional 97.1% |
| Celtics | 99.9 /100 | #48 | Exceptional 97.1% |
| Slavs | 99.9 /100 | #49 | Exceptional 97.1% |
| Immigrants | Scotland | 99.9 /100 | #50 | Exceptional 97.1% |
Demographics Similar to U.S. Virgin Islanders by 7th Grade
In terms of 7th grade, the demographic groups most similar to U.S. Virgin Islanders are Uruguayan (95.4%, a difference of 0.0%), Immigrants from Middle Africa (95.4%, a difference of 0.010%), Immigrants from Senegal (95.5%, a difference of 0.020%), Ethiopian (95.4%, a difference of 0.020%), and Immigrants from Sierra Leone (95.5%, a difference of 0.030%).
| Demographics | Rating | Rank | 7th Grade |
| Asians | 2.6 /100 | #236 | Tragic 95.5% |
| Immigrants | Asia | 2.3 /100 | #237 | Tragic 95.5% |
| Indians (Asian) | 2.3 /100 | #238 | Tragic 95.5% |
| Jamaicans | 2.2 /100 | #239 | Tragic 95.5% |
| Immigrants | Sierra Leone | 2.0 /100 | #240 | Tragic 95.5% |
| South American Indians | 2.0 /100 | #241 | Tragic 95.5% |
| Immigrants | Senegal | 1.9 /100 | #242 | Tragic 95.5% |
| U.S. Virgin Islanders | 1.6 /100 | #243 | Tragic 95.4% |
| Uruguayans | 1.6 /100 | #244 | Tragic 95.4% |
| Immigrants | Middle Africa | 1.5 /100 | #245 | Tragic 95.4% |
| Ethiopians | 1.5 /100 | #246 | Tragic 95.4% |
| Tongans | 1.3 /100 | #247 | Tragic 95.4% |
| Paiute | 1.2 /100 | #248 | Tragic 95.4% |
| Bolivians | 1.1 /100 | #249 | Tragic 95.4% |
| Immigrants | Cameroon | 0.9 /100 | #250 | Tragic 95.4% |