Immigrants from Southern Europe vs Dutch 7th Grade
COMPARE
Immigrants from Southern Europe
Dutch
7th Grade
7th Grade Comparison
Immigrants from Southern Europe
Dutch
95.7%
7TH GRADE
7.9/ 100
METRIC RATING
219th/ 347
METRIC RANK
97.9%
7TH GRADE
100.0/ 100
METRIC RATING
5th/ 347
METRIC RANK
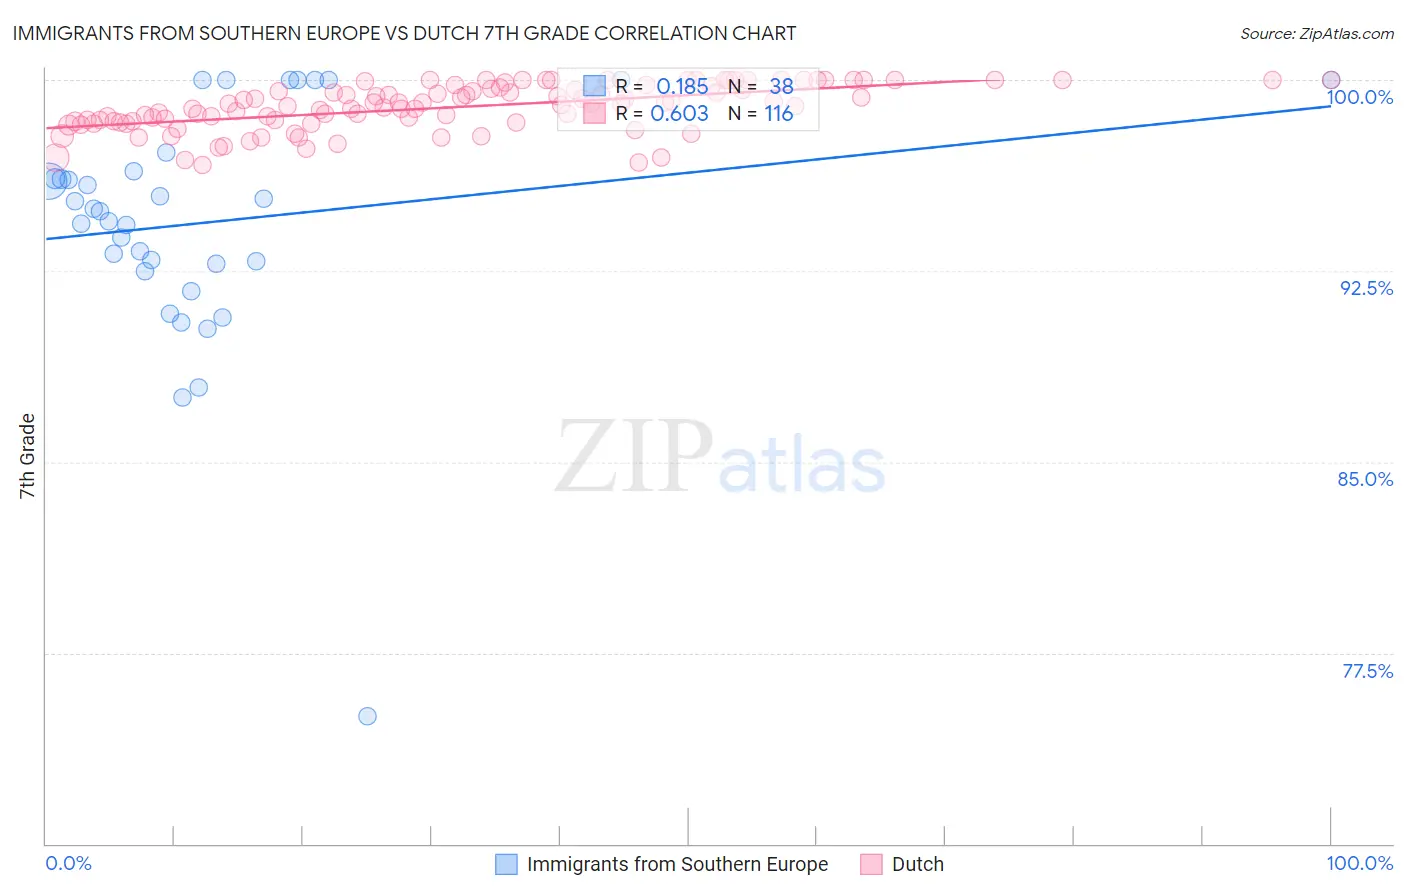
Immigrants from Southern Europe vs Dutch 7th Grade Correlation Chart
The statistical analysis conducted on geographies consisting of 402,804,595 people shows a poor positive correlation between the proportion of Immigrants from Southern Europe and percentage of population with at least 7th grade education in the United States with a correlation coefficient (R) of 0.185 and weighted average of 95.7%. Similarly, the statistical analysis conducted on geographies consisting of 361,278,890 people shows a significant positive correlation between the proportion of Dutch and percentage of population with at least 7th grade education in the United States with a correlation coefficient (R) of 0.603 and weighted average of 97.9%, a difference of 2.3%.
7th Grade Correlation Summary
| Measurement | Immigrants from Southern Europe | Dutch |
| Minimum | 75.0% | 96.6% |
| Maximum | 100.0% | 100.0% |
| Range | 25.0% | 3.4% |
| Mean | 94.4% | 98.9% |
| Median | 94.9% | 99.1% |
| Interquartile 25% (IQ1) | 92.8% | 98.4% |
| Interquartile 75% (IQ3) | 96.4% | 99.7% |
| Interquartile Range (IQR) | 3.6% | 1.3% |
| Standard Deviation (Sample) | 4.7% | 0.88% |
| Standard Deviation (Population) | 4.7% | 0.88% |
Similar Demographics by 7th Grade
Demographics Similar to Immigrants from Southern Europe by 7th Grade
In terms of 7th grade, the demographic groups most similar to Immigrants from Southern Europe are Immigrants from Liberia (95.7%, a difference of 0.0%), Immigrants from Chile (95.7%, a difference of 0.020%), Immigrants from Pakistan (95.7%, a difference of 0.020%), Subsaharan African (95.7%, a difference of 0.020%), and Samoan (95.7%, a difference of 0.020%).
| Demographics | Rating | Rank | 7th Grade |
| Immigrants | Lebanon | 13.0 /100 | #212 | Poor 95.8% |
| Immigrants | Morocco | 12.6 /100 | #213 | Poor 95.8% |
| Bahamians | 11.6 /100 | #214 | Poor 95.7% |
| Spanish Americans | 9.3 /100 | #215 | Tragic 95.7% |
| Immigrants | Chile | 9.1 /100 | #216 | Tragic 95.7% |
| Immigrants | Pakistan | 9.0 /100 | #217 | Tragic 95.7% |
| Immigrants | Liberia | 8.1 /100 | #218 | Tragic 95.7% |
| Immigrants | Southern Europe | 7.9 /100 | #219 | Tragic 95.7% |
| Sub-Saharan Africans | 7.2 /100 | #220 | Tragic 95.7% |
| Samoans | 7.0 /100 | #221 | Tragic 95.7% |
| Laotians | 6.8 /100 | #222 | Tragic 95.7% |
| Immigrants | Syria | 6.7 /100 | #223 | Tragic 95.7% |
| Immigrants | Oceania | 6.7 /100 | #224 | Tragic 95.7% |
| Immigrants | Malaysia | 6.2 /100 | #225 | Tragic 95.6% |
| Immigrants | Eastern Asia | 5.8 /100 | #226 | Tragic 95.6% |
Demographics Similar to Dutch by 7th Grade
In terms of 7th grade, the demographic groups most similar to Dutch are Tsimshian (97.8%, a difference of 0.060%), Norwegian (97.8%, a difference of 0.090%), Slovak (97.8%, a difference of 0.10%), German (97.7%, a difference of 0.13%), and Slovene (97.6%, a difference of 0.23%).
| Demographics | Rating | Rank | 7th Grade |
| Crow | 100.0 /100 | #1 | Exceptional 99.1% |
| Finns | 100.0 /100 | #2 | Exceptional 98.5% |
| Carpatho Rusyns | 100.0 /100 | #3 | Exceptional 98.3% |
| Ottawa | 100.0 /100 | #4 | Exceptional 98.1% |
| Dutch | 100.0 /100 | #5 | Exceptional 97.9% |
| Tsimshian | 100.0 /100 | #6 | Exceptional 97.8% |
| Norwegians | 100.0 /100 | #7 | Exceptional 97.8% |
| Slovaks | 100.0 /100 | #8 | Exceptional 97.8% |
| Germans | 100.0 /100 | #9 | Exceptional 97.7% |
| Slovenes | 100.0 /100 | #10 | Exceptional 97.6% |
| Alaskan Athabascans | 100.0 /100 | #11 | Exceptional 97.6% |
| Poles | 100.0 /100 | #12 | Exceptional 97.6% |
| Swedes | 100.0 /100 | #13 | Exceptional 97.6% |
| Pennsylvania Germans | 100.0 /100 | #14 | Exceptional 97.6% |
| English | 100.0 /100 | #15 | Exceptional 97.6% |