Lumbee vs Dutch 7th Grade
COMPARE
Lumbee
Dutch
7th Grade
7th Grade Comparison
Lumbee
Dutch
96.6%
7TH GRADE
97.8/ 100
METRIC RATING
107th/ 347
METRIC RANK
97.9%
7TH GRADE
100.0/ 100
METRIC RATING
5th/ 347
METRIC RANK
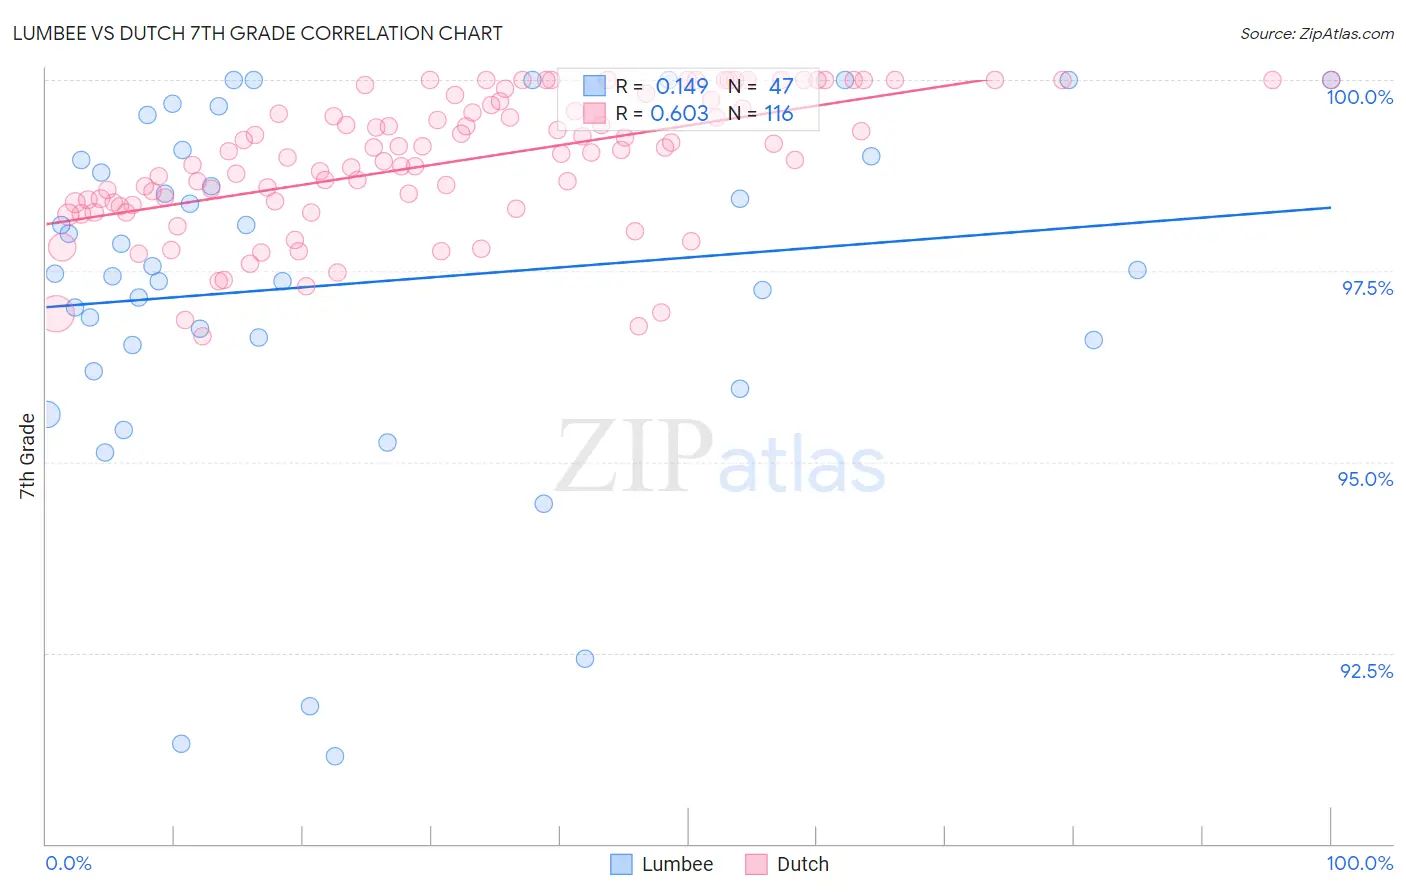
Lumbee vs Dutch 7th Grade Correlation Chart
The statistical analysis conducted on geographies consisting of 92,299,110 people shows a poor positive correlation between the proportion of Lumbee and percentage of population with at least 7th grade education in the United States with a correlation coefficient (R) of 0.149 and weighted average of 96.6%. Similarly, the statistical analysis conducted on geographies consisting of 361,278,890 people shows a significant positive correlation between the proportion of Dutch and percentage of population with at least 7th grade education in the United States with a correlation coefficient (R) of 0.603 and weighted average of 97.9%, a difference of 1.3%.
7th Grade Correlation Summary
| Measurement | Lumbee | Dutch |
| Minimum | 91.1% | 96.6% |
| Maximum | 100.0% | 100.0% |
| Range | 8.9% | 3.4% |
| Mean | 97.3% | 98.9% |
| Median | 97.5% | 99.1% |
| Interquartile 25% (IQ1) | 96.5% | 98.4% |
| Interquartile 75% (IQ3) | 99.0% | 99.7% |
| Interquartile Range (IQR) | 2.5% | 1.3% |
| Standard Deviation (Sample) | 2.3% | 0.88% |
| Standard Deviation (Population) | 2.3% | 0.88% |
Similar Demographics by 7th Grade
Demographics Similar to Lumbee by 7th Grade
In terms of 7th grade, the demographic groups most similar to Lumbee are Immigrants from Saudi Arabia (96.6%, a difference of 0.0%), Iroquois (96.6%, a difference of 0.010%), Bhutanese (96.6%, a difference of 0.010%), Shoshone (96.6%, a difference of 0.020%), and South African (96.6%, a difference of 0.020%).
| Demographics | Rating | Rank | 7th Grade |
| German Russians | 98.6 /100 | #100 | Exceptional 96.7% |
| Thais | 98.6 /100 | #101 | Exceptional 96.7% |
| Immigrants | Czechoslovakia | 98.3 /100 | #102 | Exceptional 96.6% |
| Immigrants | Singapore | 98.3 /100 | #103 | Exceptional 96.6% |
| Shoshone | 98.1 /100 | #104 | Exceptional 96.6% |
| South Africans | 98.0 /100 | #105 | Exceptional 96.6% |
| Iroquois | 97.9 /100 | #106 | Exceptional 96.6% |
| Lumbee | 97.8 /100 | #107 | Exceptional 96.6% |
| Immigrants | Saudi Arabia | 97.8 /100 | #108 | Exceptional 96.6% |
| Bhutanese | 97.7 /100 | #109 | Exceptional 96.6% |
| Okinawans | 97.4 /100 | #110 | Exceptional 96.6% |
| Immigrants | Latvia | 97.4 /100 | #111 | Exceptional 96.6% |
| Immigrants | Nonimmigrants | 97.0 /100 | #112 | Exceptional 96.5% |
| Pueblo | 96.8 /100 | #113 | Exceptional 96.5% |
| Immigrants | Zimbabwe | 96.6 /100 | #114 | Exceptional 96.5% |
Demographics Similar to Dutch by 7th Grade
In terms of 7th grade, the demographic groups most similar to Dutch are Tsimshian (97.8%, a difference of 0.060%), Norwegian (97.8%, a difference of 0.090%), Slovak (97.8%, a difference of 0.10%), German (97.7%, a difference of 0.13%), and Slovene (97.6%, a difference of 0.23%).
| Demographics | Rating | Rank | 7th Grade |
| Crow | 100.0 /100 | #1 | Exceptional 99.1% |
| Finns | 100.0 /100 | #2 | Exceptional 98.5% |
| Carpatho Rusyns | 100.0 /100 | #3 | Exceptional 98.3% |
| Ottawa | 100.0 /100 | #4 | Exceptional 98.1% |
| Dutch | 100.0 /100 | #5 | Exceptional 97.9% |
| Tsimshian | 100.0 /100 | #6 | Exceptional 97.8% |
| Norwegians | 100.0 /100 | #7 | Exceptional 97.8% |
| Slovaks | 100.0 /100 | #8 | Exceptional 97.8% |
| Germans | 100.0 /100 | #9 | Exceptional 97.7% |
| Slovenes | 100.0 /100 | #10 | Exceptional 97.6% |
| Alaskan Athabascans | 100.0 /100 | #11 | Exceptional 97.6% |
| Poles | 100.0 /100 | #12 | Exceptional 97.6% |
| Swedes | 100.0 /100 | #13 | Exceptional 97.6% |
| Pennsylvania Germans | 100.0 /100 | #14 | Exceptional 97.6% |
| English | 100.0 /100 | #15 | Exceptional 97.6% |