Macedonian vs Tohono O'odham 3rd Grade
COMPARE
Macedonian
Tohono O'odham
3rd Grade
3rd Grade Comparison
Macedonians
Tohono O'odham
98.1%
3RD GRADE
99.1/ 100
METRIC RATING
80th/ 347
METRIC RANK
97.6%
3RD GRADE
12.5/ 100
METRIC RATING
207th/ 347
METRIC RANK
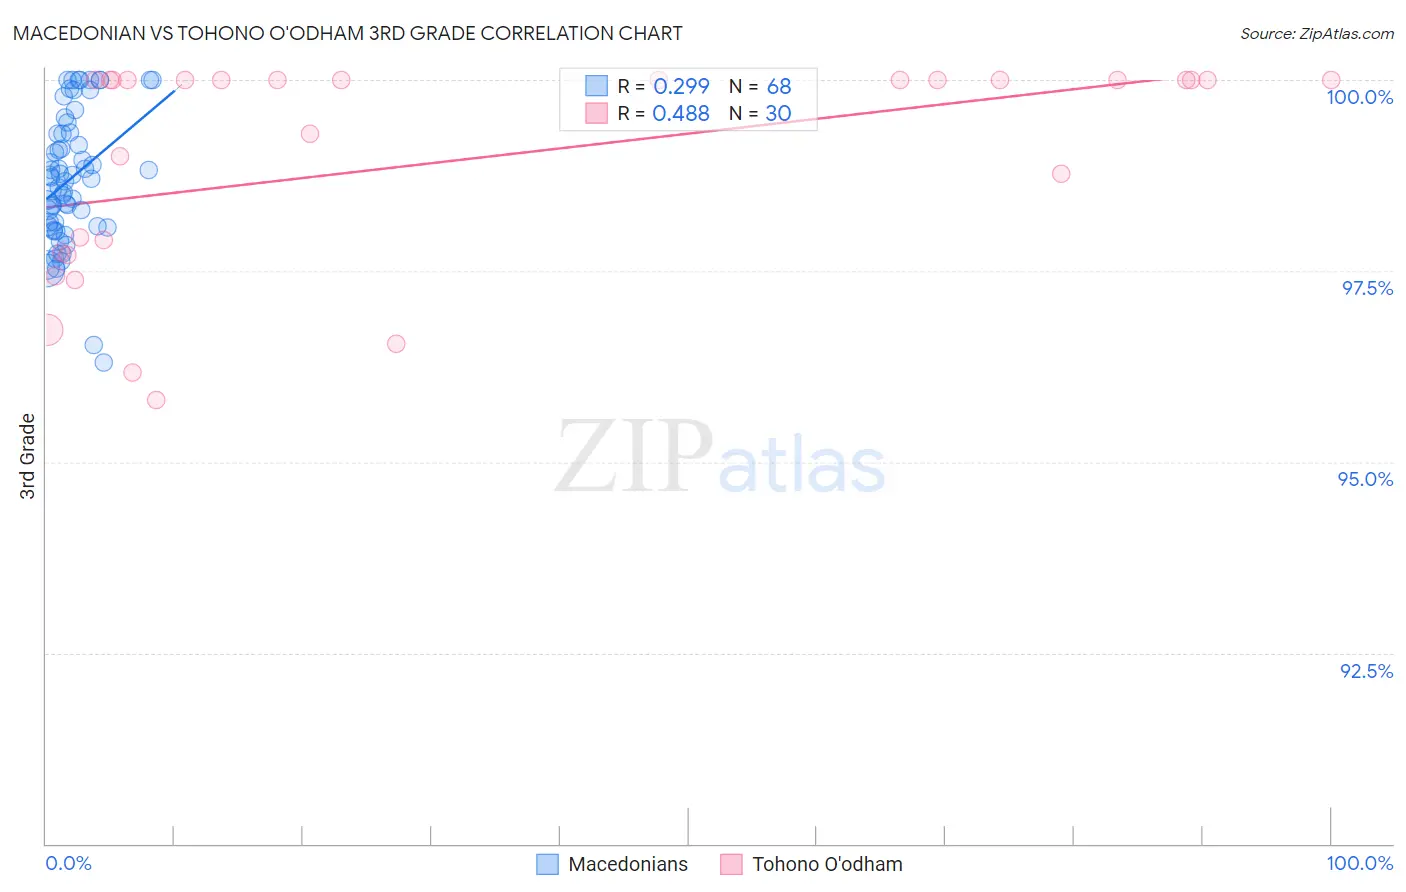
Macedonian vs Tohono O'odham 3rd Grade Correlation Chart
The statistical analysis conducted on geographies consisting of 132,592,860 people shows a weak positive correlation between the proportion of Macedonians and percentage of population with at least 3rd grade education in the United States with a correlation coefficient (R) of 0.299 and weighted average of 98.1%. Similarly, the statistical analysis conducted on geographies consisting of 58,723,100 people shows a moderate positive correlation between the proportion of Tohono O'odham and percentage of population with at least 3rd grade education in the United States with a correlation coefficient (R) of 0.488 and weighted average of 97.6%, a difference of 0.56%.
3rd Grade Correlation Summary
| Measurement | Macedonian | Tohono O'odham |
| Minimum | 96.3% | 95.8% |
| Maximum | 100.0% | 100.0% |
| Range | 3.7% | 4.2% |
| Mean | 98.7% | 98.9% |
| Median | 98.7% | 100.0% |
| Interquartile 25% (IQ1) | 98.1% | 97.7% |
| Interquartile 75% (IQ3) | 99.3% | 100.0% |
| Interquartile Range (IQR) | 1.2% | 2.3% |
| Standard Deviation (Sample) | 0.86% | 1.4% |
| Standard Deviation (Population) | 0.85% | 1.4% |
Similar Demographics by 3rd Grade
Demographics Similar to Macedonians by 3rd Grade
In terms of 3rd grade, the demographic groups most similar to Macedonians are Immigrants from Belgium (98.1%, a difference of 0.0%), Icelander (98.1%, a difference of 0.0%), Immigrants from Lithuania (98.2%, a difference of 0.010%), Osage (98.2%, a difference of 0.010%), and Shoshone (98.1%, a difference of 0.010%).
| Demographics | Rating | Rank | 3rd Grade |
| Cheyenne | 99.3 /100 | #73 | Exceptional 98.2% |
| Immigrants | Netherlands | 99.3 /100 | #74 | Exceptional 98.2% |
| Cherokee | 99.3 /100 | #75 | Exceptional 98.2% |
| Immigrants | England | 99.2 /100 | #76 | Exceptional 98.2% |
| Immigrants | Lithuania | 99.2 /100 | #77 | Exceptional 98.2% |
| Osage | 99.2 /100 | #78 | Exceptional 98.2% |
| Immigrants | Belgium | 99.1 /100 | #79 | Exceptional 98.1% |
| Macedonians | 99.1 /100 | #80 | Exceptional 98.1% |
| Icelanders | 99.1 /100 | #81 | Exceptional 98.1% |
| Shoshone | 99.0 /100 | #82 | Exceptional 98.1% |
| Ukrainians | 98.9 /100 | #83 | Exceptional 98.1% |
| Immigrants | Sweden | 98.9 /100 | #84 | Exceptional 98.1% |
| Immigrants | Australia | 98.9 /100 | #85 | Exceptional 98.1% |
| Potawatomi | 98.9 /100 | #86 | Exceptional 98.1% |
| Immigrants | Denmark | 98.8 /100 | #87 | Exceptional 98.1% |
Demographics Similar to Tohono O'odham by 3rd Grade
In terms of 3rd grade, the demographic groups most similar to Tohono O'odham are Immigrants from Northern Africa (97.6%, a difference of 0.0%), Immigrants from Zaire (97.6%, a difference of 0.0%), African (97.6%, a difference of 0.010%), Costa Rican (97.6%, a difference of 0.020%), and Immigrants from Southern Europe (97.6%, a difference of 0.030%).
| Demographics | Rating | Rank | 3rd Grade |
| Immigrants | Albania | 22.6 /100 | #200 | Fair 97.7% |
| Immigrants | Lebanon | 21.7 /100 | #201 | Fair 97.7% |
| Immigrants | Southern Europe | 17.7 /100 | #202 | Poor 97.6% |
| Paiute | 16.7 /100 | #203 | Poor 97.6% |
| Immigrants | Chile | 16.5 /100 | #204 | Poor 97.6% |
| Africans | 14.5 /100 | #205 | Poor 97.6% |
| Immigrants | Northern Africa | 13.0 /100 | #206 | Poor 97.6% |
| Tohono O'odham | 12.5 /100 | #207 | Poor 97.6% |
| Immigrants | Zaire | 11.9 /100 | #208 | Poor 97.6% |
| Costa Ricans | 9.6 /100 | #209 | Tragic 97.6% |
| Immigrants | Oceania | 9.5 /100 | #210 | Tragic 97.6% |
| Laotians | 9.4 /100 | #211 | Tragic 97.6% |
| Immigrants | Bahamas | 8.5 /100 | #212 | Tragic 97.6% |
| Moroccans | 8.5 /100 | #213 | Tragic 97.6% |
| Yuman | 8.4 /100 | #214 | Tragic 97.6% |