British vs Immigrants from Korea 1st Grade
COMPARE
British
Immigrants from Korea
1st Grade
1st Grade Comparison
British
Immigrants from Korea
98.5%
1ST GRADE
100.0/ 100
METRIC RATING
36th/ 347
METRIC RANK
97.9%
1ST GRADE
53.0/ 100
METRIC RATING
172nd/ 347
METRIC RANK
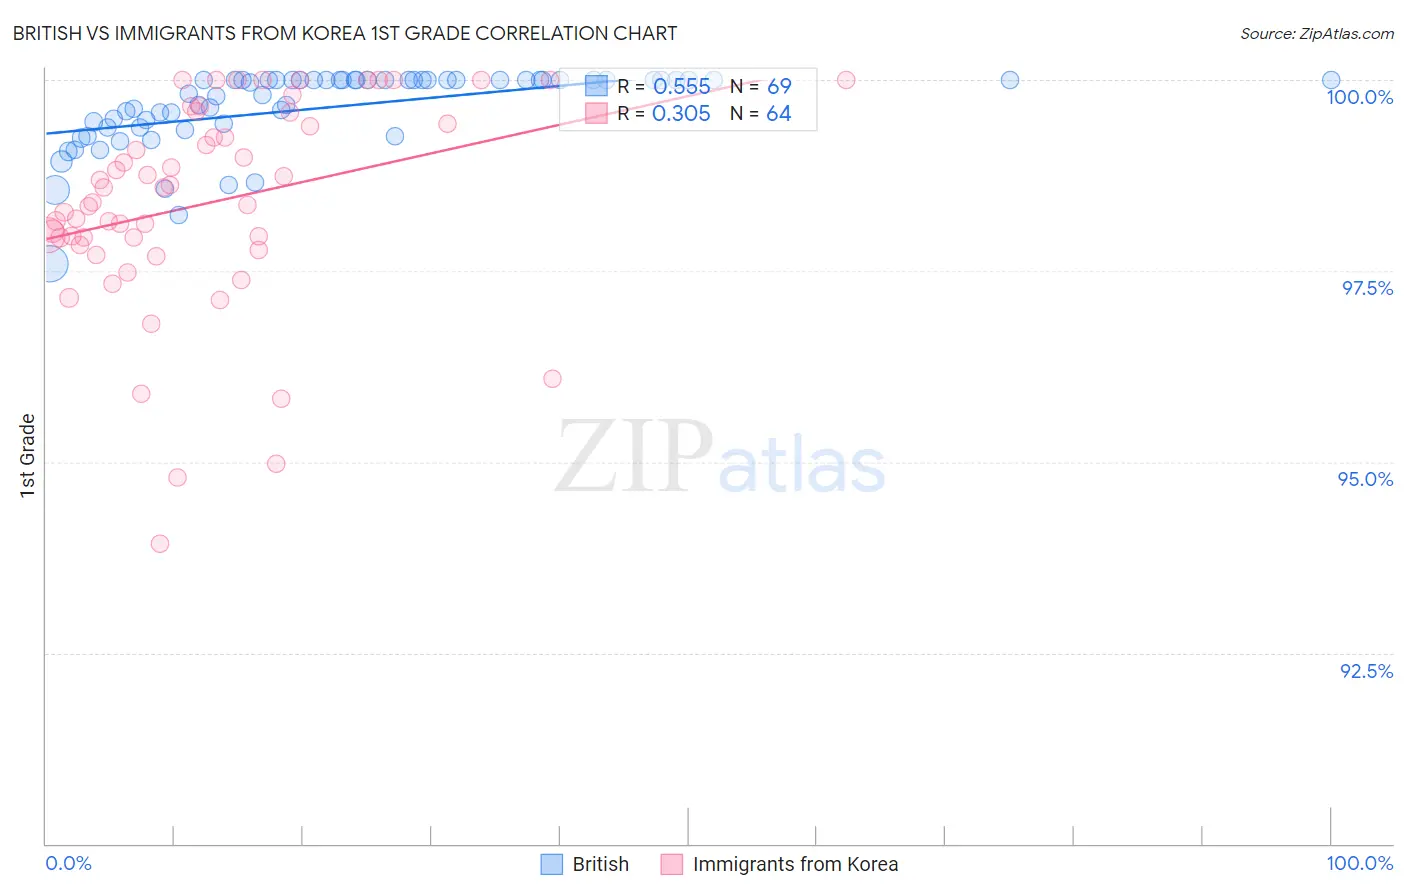
British vs Immigrants from Korea 1st Grade Correlation Chart
The statistical analysis conducted on geographies consisting of 531,462,526 people shows a substantial positive correlation between the proportion of British and percentage of population with at least 1st grade education in the United States with a correlation coefficient (R) of 0.555 and weighted average of 98.5%. Similarly, the statistical analysis conducted on geographies consisting of 416,280,076 people shows a mild positive correlation between the proportion of Immigrants from Korea and percentage of population with at least 1st grade education in the United States with a correlation coefficient (R) of 0.305 and weighted average of 97.9%, a difference of 0.58%.
1st Grade Correlation Summary
| Measurement | British | Immigrants from Korea |
| Minimum | 97.6% | 93.9% |
| Maximum | 100.0% | 100.0% |
| Range | 2.4% | 6.1% |
| Mean | 99.6% | 98.4% |
| Median | 100.0% | 98.5% |
| Interquartile 25% (IQ1) | 99.4% | 97.9% |
| Interquartile 75% (IQ3) | 100.0% | 99.5% |
| Interquartile Range (IQR) | 0.62% | 1.6% |
| Standard Deviation (Sample) | 0.51% | 1.4% |
| Standard Deviation (Population) | 0.51% | 1.4% |
Similar Demographics by 1st Grade
Demographics Similar to British by 1st Grade
In terms of 1st grade, the demographic groups most similar to British are Chinese (98.5%, a difference of 0.010%), Swiss (98.5%, a difference of 0.020%), Italian (98.5%, a difference of 0.020%), Chippewa (98.5%, a difference of 0.020%), and Latvian (98.5%, a difference of 0.030%).
| Demographics | Rating | Rank | 1st Grade |
| French | 100.0 /100 | #29 | Exceptional 98.6% |
| Europeans | 100.0 /100 | #30 | Exceptional 98.5% |
| Czechs | 100.0 /100 | #31 | Exceptional 98.5% |
| French Canadians | 100.0 /100 | #32 | Exceptional 98.5% |
| Scandinavians | 100.0 /100 | #33 | Exceptional 98.5% |
| Swiss | 100.0 /100 | #34 | Exceptional 98.5% |
| Chinese | 100.0 /100 | #35 | Exceptional 98.5% |
| British | 100.0 /100 | #36 | Exceptional 98.5% |
| Italians | 99.9 /100 | #37 | Exceptional 98.5% |
| Chippewa | 99.9 /100 | #38 | Exceptional 98.5% |
| Latvians | 99.9 /100 | #39 | Exceptional 98.5% |
| Luxembourgers | 99.9 /100 | #40 | Exceptional 98.5% |
| Eastern Europeans | 99.9 /100 | #41 | Exceptional 98.5% |
| Native Hawaiians | 99.9 /100 | #42 | Exceptional 98.5% |
| Lumbee | 99.9 /100 | #43 | Exceptional 98.5% |
Demographics Similar to Immigrants from Korea by 1st Grade
In terms of 1st grade, the demographic groups most similar to Immigrants from Korea are Immigrants from Jordan (97.9%, a difference of 0.0%), Ugandan (97.9%, a difference of 0.010%), Navajo (97.9%, a difference of 0.010%), Bermudan (97.9%, a difference of 0.010%), and Chilean (97.9%, a difference of 0.010%).
| Demographics | Rating | Rank | 1st Grade |
| Ugandans | 56.9 /100 | #165 | Average 97.9% |
| Navajo | 56.6 /100 | #166 | Average 97.9% |
| Bermudans | 56.3 /100 | #167 | Average 97.9% |
| Chileans | 55.6 /100 | #168 | Average 97.9% |
| Immigrants | Micronesia | 55.3 /100 | #169 | Average 97.9% |
| Immigrants | Spain | 54.9 /100 | #170 | Average 97.9% |
| Immigrants | Jordan | 53.9 /100 | #171 | Average 97.9% |
| Immigrants | Korea | 53.0 /100 | #172 | Average 97.9% |
| Kenyans | 51.2 /100 | #173 | Average 97.9% |
| Natives/Alaskans | 50.0 /100 | #174 | Average 97.9% |
| Immigrants | Sri Lanka | 49.7 /100 | #175 | Average 97.9% |
| Albanians | 49.6 /100 | #176 | Average 97.9% |
| Immigrants | Brazil | 49.1 /100 | #177 | Average 97.9% |
| Immigrants | Venezuela | 47.8 /100 | #178 | Average 97.9% |
| Argentineans | 47.2 /100 | #179 | Average 97.9% |