Macedonian vs Austrian 1st Grade
COMPARE
Macedonian
Austrian
1st Grade
1st Grade Comparison
Macedonians
Austrians
98.3%
1ST GRADE
98.7/ 100
METRIC RATING
92nd/ 347
METRIC RANK
98.4%
1ST GRADE
99.8/ 100
METRIC RATING
57th/ 347
METRIC RANK
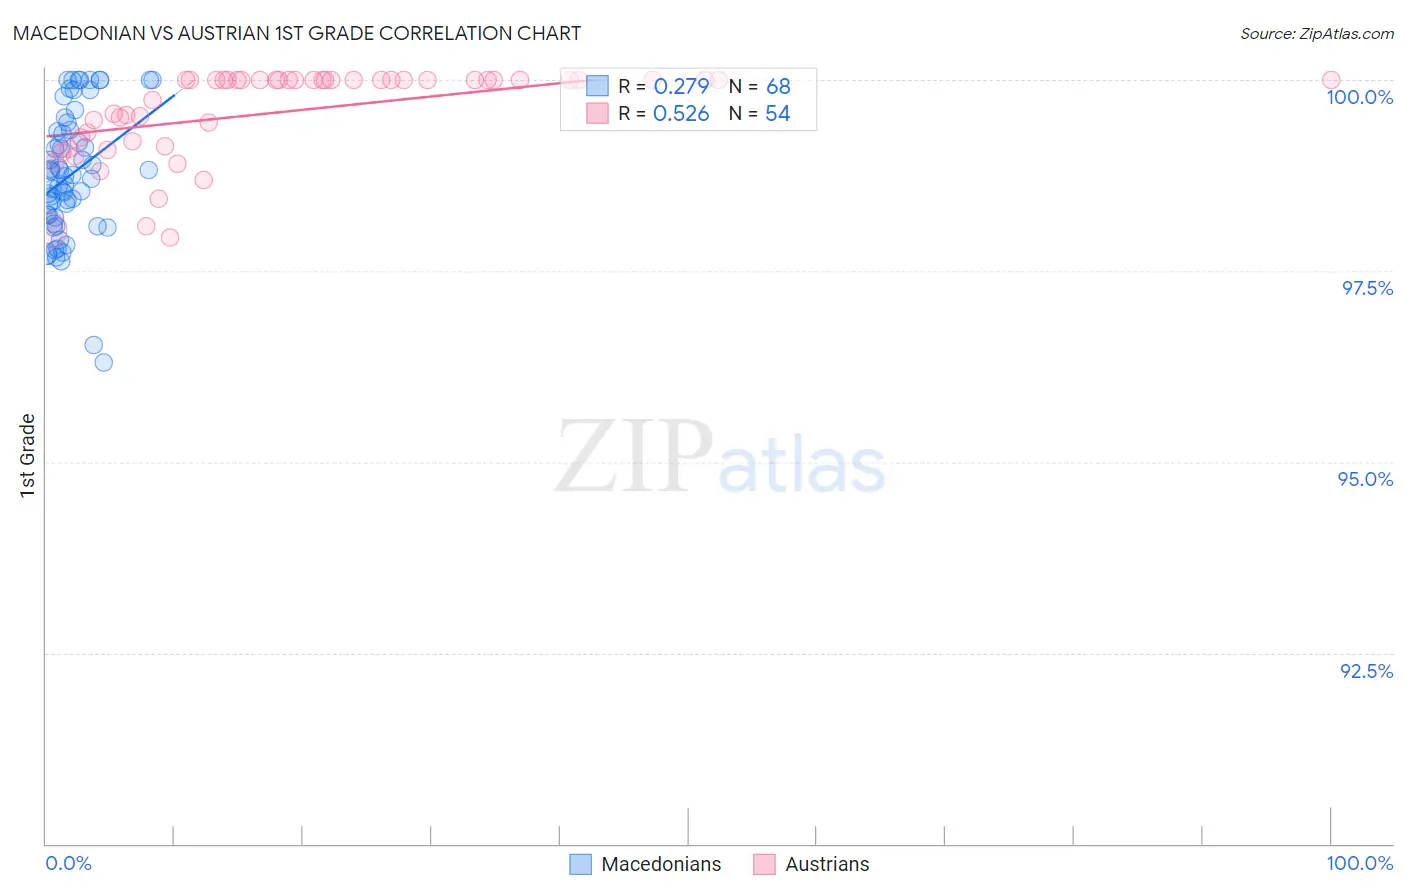
Macedonian vs Austrian 1st Grade Correlation Chart
The statistical analysis conducted on geographies consisting of 132,592,860 people shows a weak positive correlation between the proportion of Macedonians and percentage of population with at least 1st grade education in the United States with a correlation coefficient (R) of 0.279 and weighted average of 98.3%. Similarly, the statistical analysis conducted on geographies consisting of 452,080,536 people shows a substantial positive correlation between the proportion of Austrians and percentage of population with at least 1st grade education in the United States with a correlation coefficient (R) of 0.526 and weighted average of 98.4%, a difference of 0.13%.
1st Grade Correlation Summary
| Measurement | Macedonian | Austrian |
| Minimum | 96.3% | 97.9% |
| Maximum | 100.0% | 100.0% |
| Range | 3.7% | 2.1% |
| Mean | 98.8% | 99.6% |
| Median | 98.8% | 100.0% |
| Interquartile 25% (IQ1) | 98.2% | 99.2% |
| Interquartile 75% (IQ3) | 99.3% | 100.0% |
| Interquartile Range (IQR) | 1.1% | 0.81% |
| Standard Deviation (Sample) | 0.83% | 0.58% |
| Standard Deviation (Population) | 0.83% | 0.58% |
Similar Demographics by 1st Grade
Demographics Similar to Macedonians by 1st Grade
In terms of 1st grade, the demographic groups most similar to Macedonians are Immigrants from Western Europe (98.3%, a difference of 0.0%), Zimbabwean (98.3%, a difference of 0.010%), Immigrants from South Africa (98.3%, a difference of 0.010%), Ukrainian (98.3%, a difference of 0.010%), and Immigrants from India (98.2%, a difference of 0.010%).
| Demographics | Rating | Rank | 1st Grade |
| Hopi | 99.0 /100 | #85 | Exceptional 98.3% |
| Immigrants | Denmark | 99.0 /100 | #86 | Exceptional 98.3% |
| Immigrants | Australia | 99.0 /100 | #87 | Exceptional 98.3% |
| Zimbabweans | 98.9 /100 | #88 | Exceptional 98.3% |
| Immigrants | South Africa | 98.8 /100 | #89 | Exceptional 98.3% |
| Ukrainians | 98.8 /100 | #90 | Exceptional 98.3% |
| Immigrants | Western Europe | 98.8 /100 | #91 | Exceptional 98.3% |
| Macedonians | 98.7 /100 | #92 | Exceptional 98.3% |
| Immigrants | India | 98.6 /100 | #93 | Exceptional 98.2% |
| South Africans | 98.6 /100 | #94 | Exceptional 98.2% |
| Immigrants | Germany | 98.5 /100 | #95 | Exceptional 98.2% |
| Cypriots | 98.3 /100 | #96 | Exceptional 98.2% |
| Immigrants | Nonimmigrants | 98.3 /100 | #97 | Exceptional 98.2% |
| Choctaw | 98.3 /100 | #98 | Exceptional 98.2% |
| Puget Sound Salish | 98.2 /100 | #99 | Exceptional 98.2% |
Demographics Similar to Austrians by 1st Grade
In terms of 1st grade, the demographic groups most similar to Austrians are American (98.4%, a difference of 0.0%), New Zealander (98.4%, a difference of 0.0%), Immigrants from Scotland (98.4%, a difference of 0.010%), Creek (98.4%, a difference of 0.010%), and Immigrants from Canada (98.4%, a difference of 0.010%).
| Demographics | Rating | Rank | 1st Grade |
| Whites/Caucasians | 99.8 /100 | #50 | Exceptional 98.4% |
| Estonians | 99.8 /100 | #51 | Exceptional 98.4% |
| Pueblo | 99.8 /100 | #52 | Exceptional 98.4% |
| Kiowa | 99.8 /100 | #53 | Exceptional 98.4% |
| Australians | 99.8 /100 | #54 | Exceptional 98.4% |
| Immigrants | Scotland | 99.8 /100 | #55 | Exceptional 98.4% |
| Americans | 99.8 /100 | #56 | Exceptional 98.4% |
| Austrians | 99.8 /100 | #57 | Exceptional 98.4% |
| New Zealanders | 99.7 /100 | #58 | Exceptional 98.4% |
| Creek | 99.7 /100 | #59 | Exceptional 98.4% |
| Immigrants | Canada | 99.7 /100 | #60 | Exceptional 98.4% |
| Bulgarians | 99.7 /100 | #61 | Exceptional 98.4% |
| Slavs | 99.7 /100 | #62 | Exceptional 98.4% |
| Immigrants | North America | 99.7 /100 | #63 | Exceptional 98.4% |
| Greeks | 99.7 /100 | #64 | Exceptional 98.4% |