Immigrants from Middle Africa vs Immigrants from Austria Doctorate Degree
COMPARE
Immigrants from Middle Africa
Immigrants from Austria
Doctorate Degree
Doctorate Degree Comparison
Immigrants from Middle Africa
Immigrants from Austria
1.9%
DOCTORATE DEGREE
68.8/ 100
METRIC RATING
161st/ 347
METRIC RANK
2.4%
DOCTORATE DEGREE
100.0/ 100
METRIC RATING
46th/ 347
METRIC RANK
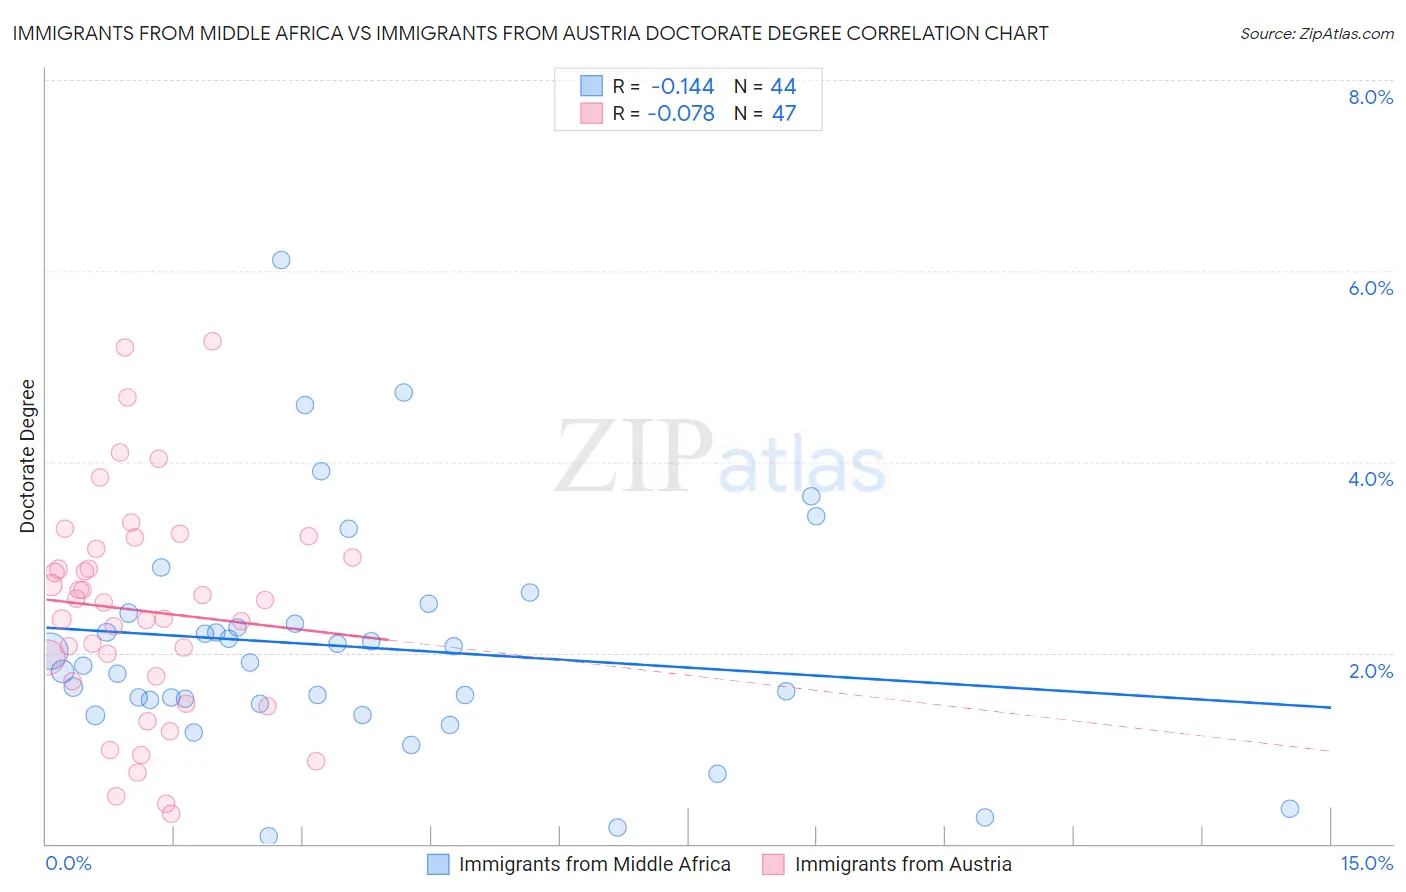
Immigrants from Middle Africa vs Immigrants from Austria Doctorate Degree Correlation Chart
The statistical analysis conducted on geographies consisting of 202,038,624 people shows a poor negative correlation between the proportion of Immigrants from Middle Africa and percentage of population with at least doctorate degree education in the United States with a correlation coefficient (R) of -0.144 and weighted average of 1.9%. Similarly, the statistical analysis conducted on geographies consisting of 167,487,271 people shows a slight negative correlation between the proportion of Immigrants from Austria and percentage of population with at least doctorate degree education in the United States with a correlation coefficient (R) of -0.078 and weighted average of 2.4%, a difference of 29.0%.
Doctorate Degree Correlation Summary
| Measurement | Immigrants from Middle Africa | Immigrants from Austria |
| Minimum | 0.076% | 0.31% |
| Maximum | 6.1% | 5.3% |
| Range | 6.0% | 4.9% |
| Mean | 2.1% | 2.4% |
| Median | 1.9% | 2.5% |
| Interquartile 25% (IQ1) | 1.5% | 1.7% |
| Interquartile 75% (IQ3) | 2.4% | 3.1% |
| Interquartile Range (IQR) | 0.87% | 1.4% |
| Standard Deviation (Sample) | 1.2% | 1.2% |
| Standard Deviation (Population) | 1.2% | 1.1% |
Similar Demographics by Doctorate Degree
Demographics Similar to Immigrants from Middle Africa by Doctorate Degree
In terms of doctorate degree, the demographic groups most similar to Immigrants from Middle Africa are Welsh (1.9%, a difference of 0.15%), Irish (1.9%, a difference of 0.21%), Slovene (1.9%, a difference of 0.24%), Czech (1.9%, a difference of 0.25%), and Celtic (1.9%, a difference of 0.35%).
| Demographics | Rating | Rank | Doctorate Degree |
| Immigrants | Albania | 72.8 /100 | #154 | Good 1.9% |
| Poles | 72.7 /100 | #155 | Good 1.9% |
| Slavs | 72.4 /100 | #156 | Good 1.9% |
| Danes | 71.9 /100 | #157 | Good 1.9% |
| Hungarians | 71.7 /100 | #158 | Good 1.9% |
| Slovenes | 70.2 /100 | #159 | Good 1.9% |
| Welsh | 69.7 /100 | #160 | Good 1.9% |
| Immigrants | Middle Africa | 68.8 /100 | #161 | Good 1.9% |
| Irish | 67.5 /100 | #162 | Good 1.9% |
| Czechs | 67.3 /100 | #163 | Good 1.9% |
| Celtics | 66.7 /100 | #164 | Good 1.9% |
| Scotch-Irish | 63.6 /100 | #165 | Good 1.9% |
| Spaniards | 63.5 /100 | #166 | Good 1.9% |
| Macedonians | 60.9 /100 | #167 | Good 1.9% |
| Sri Lankans | 60.3 /100 | #168 | Good 1.9% |
Demographics Similar to Immigrants from Austria by Doctorate Degree
In terms of doctorate degree, the demographic groups most similar to Immigrants from Austria are Immigrants from South Africa (2.4%, a difference of 0.14%), Immigrants from Western Europe (2.4%, a difference of 0.22%), Asian (2.4%, a difference of 0.44%), Immigrants from Asia (2.4%, a difference of 0.57%), and Immigrants from Netherlands (2.5%, a difference of 1.7%).
| Demographics | Rating | Rank | Doctorate Degree |
| Immigrants | Ireland | 100.0 /100 | #39 | Exceptional 2.5% |
| Estonians | 100.0 /100 | #40 | Exceptional 2.5% |
| Immigrants | Russia | 100.0 /100 | #41 | Exceptional 2.5% |
| New Zealanders | 100.0 /100 | #42 | Exceptional 2.5% |
| Soviet Union | 100.0 /100 | #43 | Exceptional 2.5% |
| Immigrants | Netherlands | 100.0 /100 | #44 | Exceptional 2.5% |
| Immigrants | South Africa | 100.0 /100 | #45 | Exceptional 2.4% |
| Immigrants | Austria | 100.0 /100 | #46 | Exceptional 2.4% |
| Immigrants | Western Europe | 100.0 /100 | #47 | Exceptional 2.4% |
| Asians | 100.0 /100 | #48 | Exceptional 2.4% |
| Immigrants | Asia | 100.0 /100 | #49 | Exceptional 2.4% |
| Immigrants | Norway | 100.0 /100 | #50 | Exceptional 2.4% |
| Australians | 100.0 /100 | #51 | Exceptional 2.4% |
| Bulgarians | 100.0 /100 | #52 | Exceptional 2.4% |
| Immigrants | Latvia | 100.0 /100 | #53 | Exceptional 2.4% |