Colombian vs Osage Nursery School
COMPARE
Colombian
Osage
Nursery School
Nursery School Comparison
Colombians
Osage
97.7%
NURSERY SCHOOL
2.1/ 100
METRIC RATING
234th/ 347
METRIC RANK
98.3%
NURSERY SCHOOL
99.1/ 100
METRIC RATING
83rd/ 347
METRIC RANK
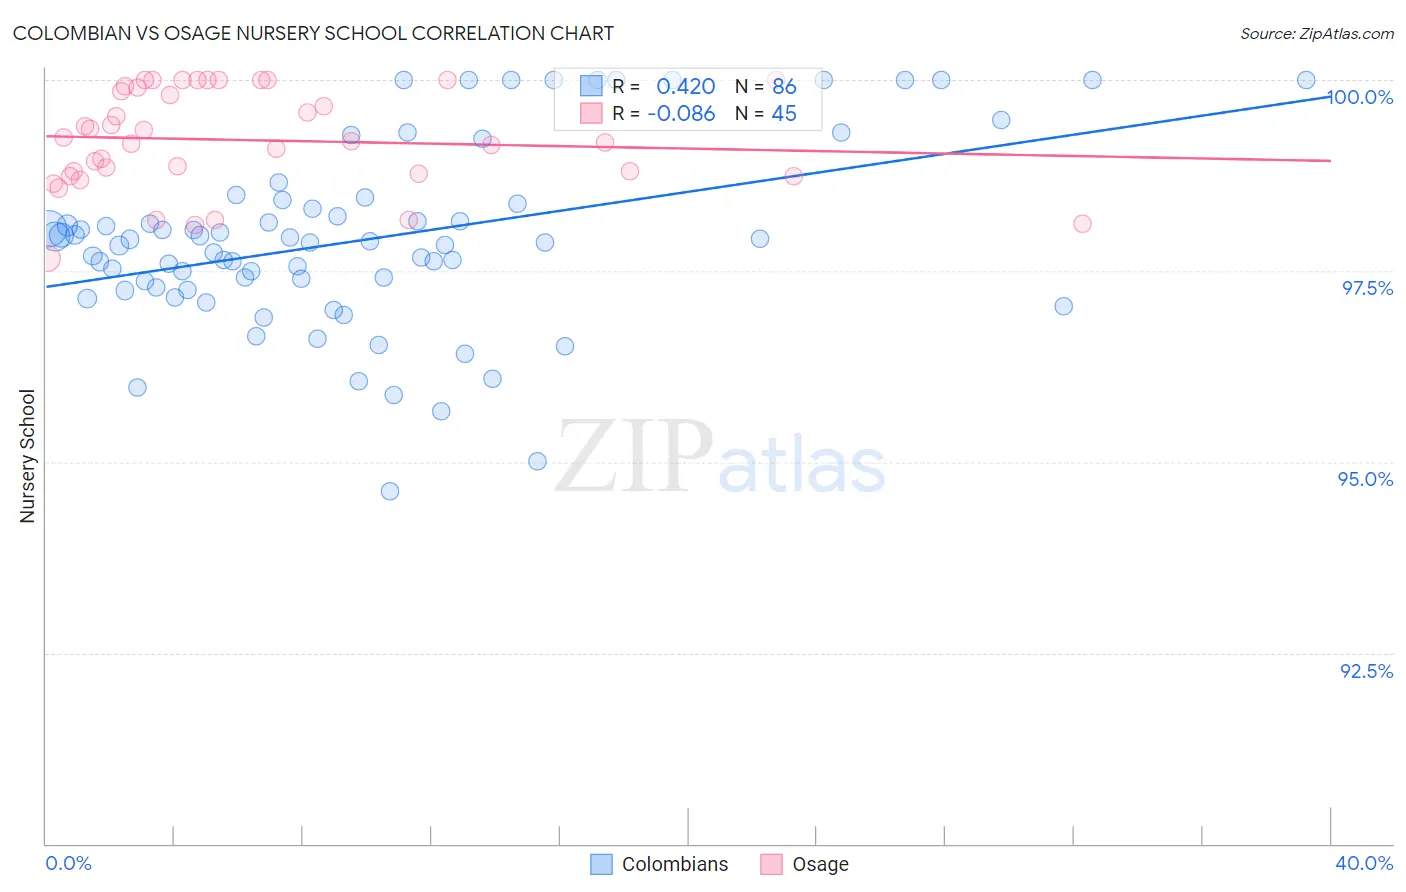
Colombian vs Osage Nursery School Correlation Chart
The statistical analysis conducted on geographies consisting of 419,700,680 people shows a moderate positive correlation between the proportion of Colombians and percentage of population with at least nursery school education in the United States with a correlation coefficient (R) of 0.420 and weighted average of 97.7%. Similarly, the statistical analysis conducted on geographies consisting of 91,808,929 people shows a slight negative correlation between the proportion of Osage and percentage of population with at least nursery school education in the United States with a correlation coefficient (R) of -0.086 and weighted average of 98.3%, a difference of 0.64%.
Nursery School Correlation Summary
| Measurement | Colombian | Osage |
| Minimum | 94.6% | 97.7% |
| Maximum | 100.0% | 100.0% |
| Range | 5.4% | 2.3% |
| Mean | 97.9% | 99.2% |
| Median | 97.9% | 99.2% |
| Interquartile 25% (IQ1) | 97.3% | 98.8% |
| Interquartile 75% (IQ3) | 98.4% | 99.9% |
| Interquartile Range (IQR) | 1.1% | 1.1% |
| Standard Deviation (Sample) | 1.2% | 0.66% |
| Standard Deviation (Population) | 1.2% | 0.65% |
Similar Demographics by Nursery School
Demographics Similar to Colombians by Nursery School
In terms of nursery school, the demographic groups most similar to Colombians are U.S. Virgin Islander (97.7%, a difference of 0.0%), Immigrants from Pakistan (97.7%, a difference of 0.0%), Immigrants from Uruguay (97.7%, a difference of 0.010%), Immigrants from Malaysia (97.7%, a difference of 0.010%), and Immigrants from Western Asia (97.7%, a difference of 0.010%).
| Demographics | Rating | Rank | Nursery School |
| Sub-Saharan Africans | 3.2 /100 | #227 | Tragic 97.7% |
| Sudanese | 3.2 /100 | #228 | Tragic 97.7% |
| Senegalese | 3.2 /100 | #229 | Tragic 97.7% |
| Sierra Leoneans | 2.9 /100 | #230 | Tragic 97.7% |
| Puerto Ricans | 2.6 /100 | #231 | Tragic 97.7% |
| Immigrants | Uruguay | 2.3 /100 | #232 | Tragic 97.7% |
| U.S. Virgin Islanders | 2.1 /100 | #233 | Tragic 97.7% |
| Colombians | 2.1 /100 | #234 | Tragic 97.7% |
| Immigrants | Pakistan | 2.1 /100 | #235 | Tragic 97.7% |
| Immigrants | Malaysia | 1.9 /100 | #236 | Tragic 97.7% |
| Immigrants | Western Asia | 1.9 /100 | #237 | Tragic 97.7% |
| Nigerians | 1.7 /100 | #238 | Tragic 97.7% |
| Immigrants | Eastern Asia | 1.6 /100 | #239 | Tragic 97.7% |
| Koreans | 1.4 /100 | #240 | Tragic 97.7% |
| Immigrants | Indonesia | 1.1 /100 | #241 | Tragic 97.7% |
Demographics Similar to Osage by Nursery School
In terms of nursery school, the demographic groups most similar to Osage are Immigrants from Denmark (98.3%, a difference of 0.0%), Immigrants from Sweden (98.3%, a difference of 0.0%), Immigrants from Belgium (98.3%, a difference of 0.010%), Shoshone (98.3%, a difference of 0.010%), and Icelander (98.3%, a difference of 0.010%).
| Demographics | Rating | Rank | Nursery School |
| Immigrants | England | 99.3 /100 | #76 | Exceptional 98.3% |
| Immigrants | Lithuania | 99.3 /100 | #77 | Exceptional 98.3% |
| Delaware | 99.3 /100 | #78 | Exceptional 98.3% |
| Immigrants | Belgium | 99.3 /100 | #79 | Exceptional 98.3% |
| Shoshone | 99.3 /100 | #80 | Exceptional 98.3% |
| Icelanders | 99.2 /100 | #81 | Exceptional 98.3% |
| Potawatomi | 99.2 /100 | #82 | Exceptional 98.3% |
| Osage | 99.1 /100 | #83 | Exceptional 98.3% |
| Immigrants | Denmark | 99.1 /100 | #84 | Exceptional 98.3% |
| Immigrants | Sweden | 99.1 /100 | #85 | Exceptional 98.3% |
| Immigrants | Australia | 99.0 /100 | #86 | Exceptional 98.3% |
| Hopi | 98.9 /100 | #87 | Exceptional 98.3% |
| Ukrainians | 98.9 /100 | #88 | Exceptional 98.3% |
| Immigrants | South Africa | 98.8 /100 | #89 | Exceptional 98.3% |
| Immigrants | Western Europe | 98.8 /100 | #90 | Exceptional 98.3% |