Luxembourger vs Marshallese Professional Degree
COMPARE
Luxembourger
Marshallese
Professional Degree
Professional Degree Comparison
Luxembourgers
Marshallese
4.6%
PROFESSIONAL DEGREE
78.7/ 100
METRIC RATING
146th/ 347
METRIC RANK
3.8%
PROFESSIONAL DEGREE
1.7/ 100
METRIC RATING
246th/ 347
METRIC RANK
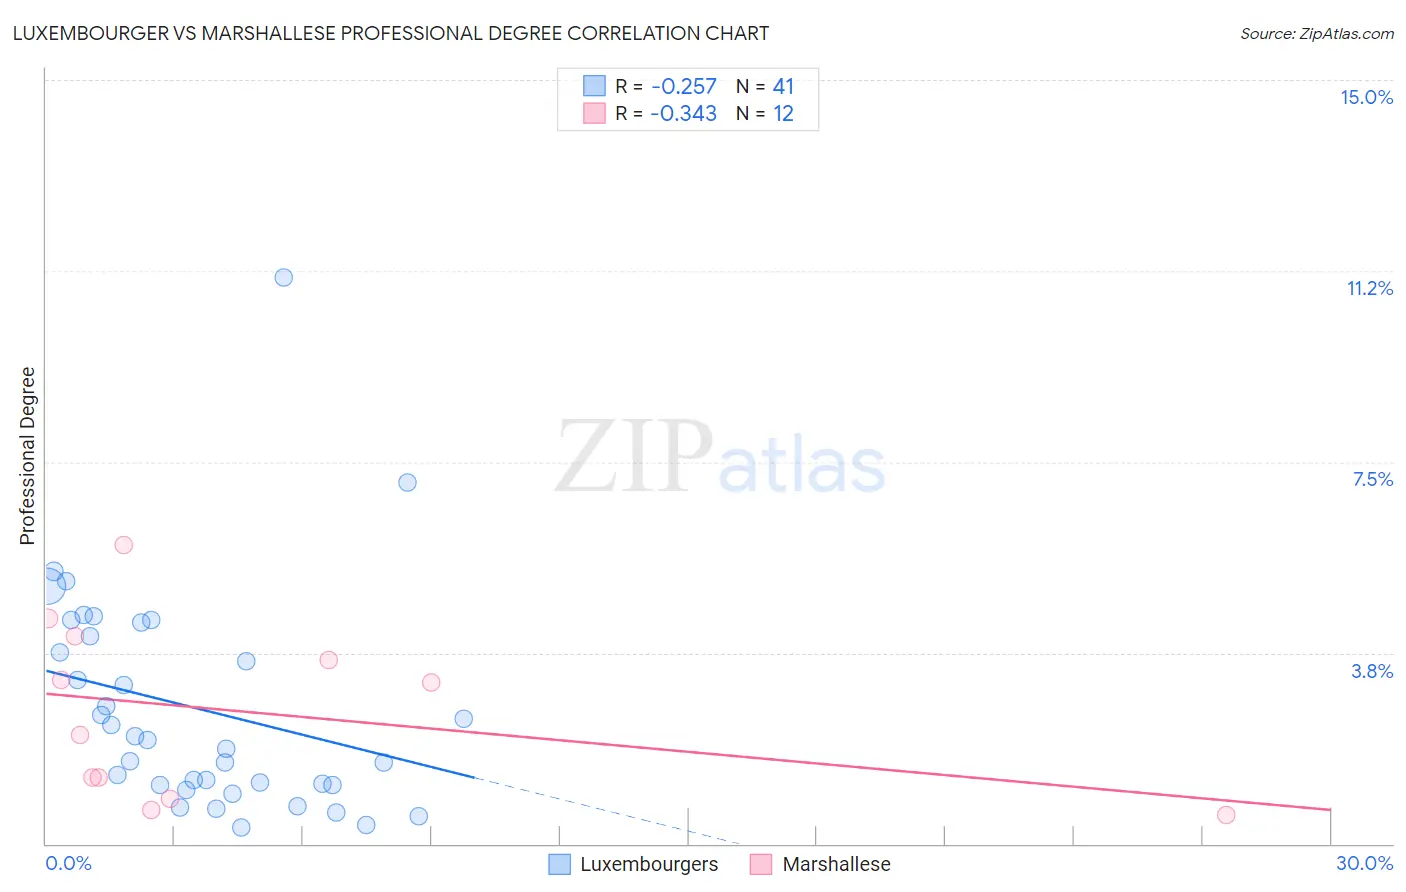
Luxembourger vs Marshallese Professional Degree Correlation Chart
The statistical analysis conducted on geographies consisting of 144,524,005 people shows a weak negative correlation between the proportion of Luxembourgers and percentage of population with at least professional degree education in the United States with a correlation coefficient (R) of -0.257 and weighted average of 4.6%. Similarly, the statistical analysis conducted on geographies consisting of 14,750,149 people shows a mild negative correlation between the proportion of Marshallese and percentage of population with at least professional degree education in the United States with a correlation coefficient (R) of -0.343 and weighted average of 3.8%, a difference of 23.0%.
Professional Degree Correlation Summary
| Measurement | Luxembourger | Marshallese |
| Minimum | 0.31% | 0.57% |
| Maximum | 11.1% | 5.9% |
| Range | 10.8% | 5.3% |
| Mean | 2.7% | 2.6% |
| Median | 2.0% | 2.6% |
| Interquartile 25% (IQ1) | 1.2% | 1.1% |
| Interquartile 75% (IQ3) | 4.2% | 3.8% |
| Interquartile Range (IQR) | 3.1% | 2.8% |
| Standard Deviation (Sample) | 2.2% | 1.7% |
| Standard Deviation (Population) | 2.1% | 1.6% |
Similar Demographics by Professional Degree
Demographics Similar to Luxembourgers by Professional Degree
In terms of professional degree, the demographic groups most similar to Luxembourgers are Colombian (4.6%, a difference of 0.21%), Uruguayan (4.6%, a difference of 0.31%), Immigrants from South America (4.6%, a difference of 0.37%), Hungarian (4.6%, a difference of 0.44%), and Slovene (4.6%, a difference of 0.53%).
| Demographics | Rating | Rank | Professional Degree |
| South Americans | 85.6 /100 | #139 | Excellent 4.7% |
| Canadians | 84.4 /100 | #140 | Excellent 4.7% |
| Basques | 81.8 /100 | #141 | Excellent 4.6% |
| Sudanese | 81.3 /100 | #142 | Excellent 4.6% |
| Hungarians | 80.8 /100 | #143 | Excellent 4.6% |
| Immigrants | South America | 80.5 /100 | #144 | Excellent 4.6% |
| Uruguayans | 80.2 /100 | #145 | Excellent 4.6% |
| Luxembourgers | 78.7 /100 | #146 | Good 4.6% |
| Colombians | 77.7 /100 | #147 | Good 4.6% |
| Slovenes | 76.1 /100 | #148 | Good 4.6% |
| Senegalese | 75.3 /100 | #149 | Good 4.6% |
| Immigrants | Oceania | 73.4 /100 | #150 | Good 4.6% |
| Poles | 72.6 /100 | #151 | Good 4.6% |
| Immigrants | Africa | 72.5 /100 | #152 | Good 4.6% |
| Immigrants | Uruguay | 72.5 /100 | #153 | Good 4.6% |
Demographics Similar to Marshallese by Professional Degree
In terms of professional degree, the demographic groups most similar to Marshallese are Guyanese (3.8%, a difference of 0.020%), French American Indian (3.8%, a difference of 0.17%), Hmong (3.7%, a difference of 0.18%), Immigrants from Grenada (3.7%, a difference of 0.30%), and Immigrants from Fiji (3.7%, a difference of 0.36%).
| Demographics | Rating | Rank | Professional Degree |
| British West Indians | 2.4 /100 | #239 | Tragic 3.8% |
| Immigrants | Ecuador | 2.3 /100 | #240 | Tragic 3.8% |
| Alaskan Athabascans | 2.3 /100 | #241 | Tragic 3.8% |
| Native Hawaiians | 2.3 /100 | #242 | Tragic 3.8% |
| Guamanians/Chamorros | 2.2 /100 | #243 | Tragic 3.8% |
| Immigrants | Bahamas | 2.0 /100 | #244 | Tragic 3.8% |
| French American Indians | 1.7 /100 | #245 | Tragic 3.8% |
| Marshallese | 1.7 /100 | #246 | Tragic 3.8% |
| Guyanese | 1.6 /100 | #247 | Tragic 3.8% |
| Hmong | 1.6 /100 | #248 | Tragic 3.7% |
| Immigrants | Grenada | 1.5 /100 | #249 | Tragic 3.7% |
| Immigrants | Fiji | 1.5 /100 | #250 | Tragic 3.7% |
| Immigrants | Nicaragua | 1.4 /100 | #251 | Tragic 3.7% |
| Jamaicans | 1.4 /100 | #252 | Tragic 3.7% |
| Pueblo | 1.4 /100 | #253 | Tragic 3.7% |