Luxembourger vs Lithuanian Professional Degree
COMPARE
Luxembourger
Lithuanian
Professional Degree
Professional Degree Comparison
Luxembourgers
Lithuanians
4.6%
PROFESSIONAL DEGREE
78.7/ 100
METRIC RATING
146th/ 347
METRIC RANK
5.4%
PROFESSIONAL DEGREE
99.8/ 100
METRIC RATING
72nd/ 347
METRIC RANK
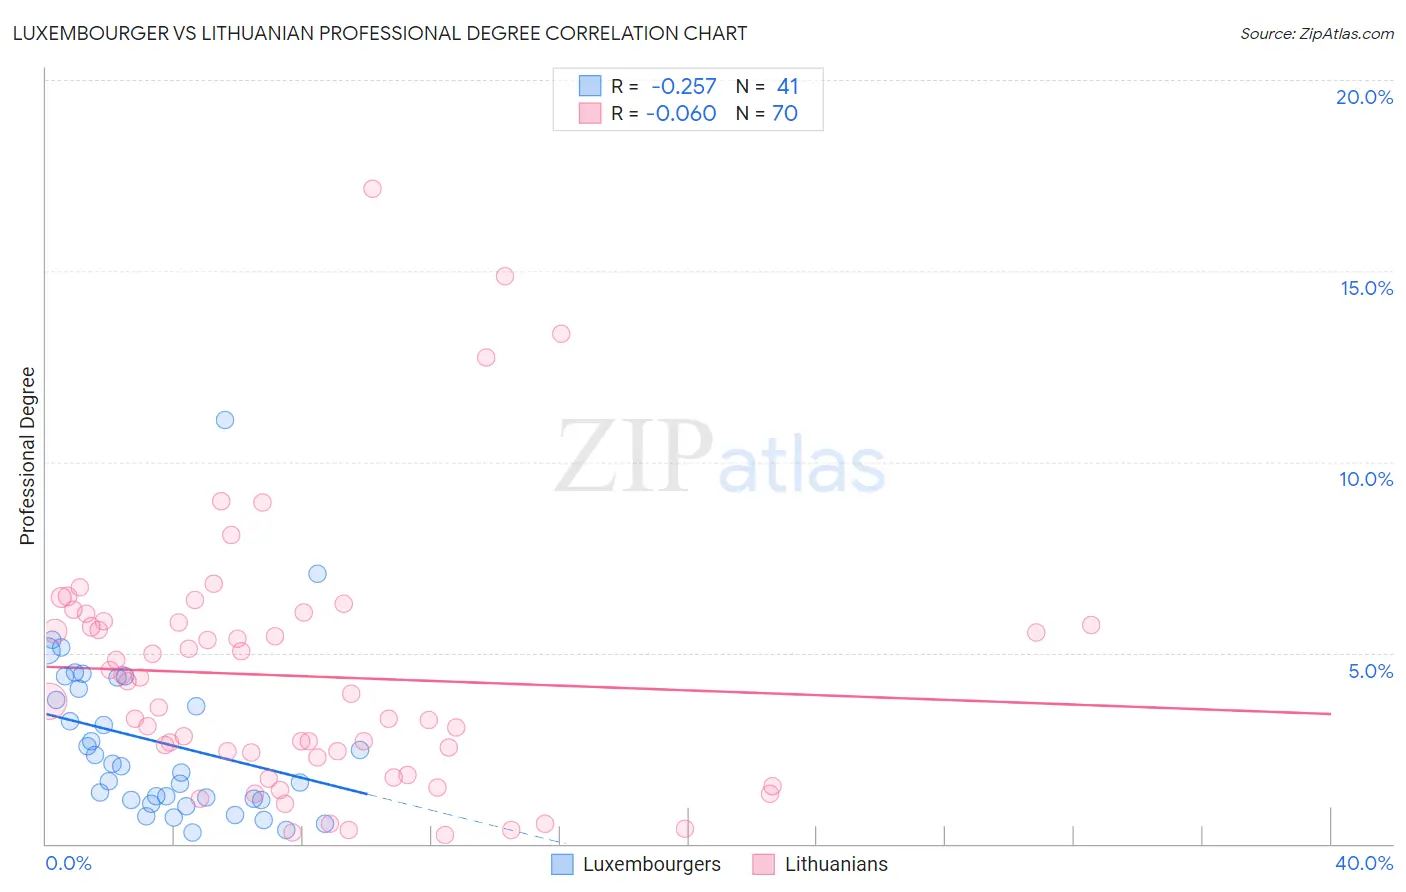
Luxembourger vs Lithuanian Professional Degree Correlation Chart
The statistical analysis conducted on geographies consisting of 144,524,005 people shows a weak negative correlation between the proportion of Luxembourgers and percentage of population with at least professional degree education in the United States with a correlation coefficient (R) of -0.257 and weighted average of 4.6%. Similarly, the statistical analysis conducted on geographies consisting of 420,702,228 people shows a slight negative correlation between the proportion of Lithuanians and percentage of population with at least professional degree education in the United States with a correlation coefficient (R) of -0.060 and weighted average of 5.4%, a difference of 16.6%.
Professional Degree Correlation Summary
| Measurement | Luxembourger | Lithuanian |
| Minimum | 0.31% | 0.24% |
| Maximum | 11.1% | 17.2% |
| Range | 10.8% | 16.9% |
| Mean | 2.7% | 4.4% |
| Median | 2.0% | 3.8% |
| Interquartile 25% (IQ1) | 1.2% | 2.3% |
| Interquartile 75% (IQ3) | 4.2% | 5.8% |
| Interquartile Range (IQR) | 3.1% | 3.5% |
| Standard Deviation (Sample) | 2.2% | 3.4% |
| Standard Deviation (Population) | 2.1% | 3.3% |
Similar Demographics by Professional Degree
Demographics Similar to Luxembourgers by Professional Degree
In terms of professional degree, the demographic groups most similar to Luxembourgers are Colombian (4.6%, a difference of 0.21%), Uruguayan (4.6%, a difference of 0.31%), Immigrants from South America (4.6%, a difference of 0.37%), Hungarian (4.6%, a difference of 0.44%), and Slovene (4.6%, a difference of 0.53%).
| Demographics | Rating | Rank | Professional Degree |
| South Americans | 85.6 /100 | #139 | Excellent 4.7% |
| Canadians | 84.4 /100 | #140 | Excellent 4.7% |
| Basques | 81.8 /100 | #141 | Excellent 4.6% |
| Sudanese | 81.3 /100 | #142 | Excellent 4.6% |
| Hungarians | 80.8 /100 | #143 | Excellent 4.6% |
| Immigrants | South America | 80.5 /100 | #144 | Excellent 4.6% |
| Uruguayans | 80.2 /100 | #145 | Excellent 4.6% |
| Luxembourgers | 78.7 /100 | #146 | Good 4.6% |
| Colombians | 77.7 /100 | #147 | Good 4.6% |
| Slovenes | 76.1 /100 | #148 | Good 4.6% |
| Senegalese | 75.3 /100 | #149 | Good 4.6% |
| Immigrants | Oceania | 73.4 /100 | #150 | Good 4.6% |
| Poles | 72.6 /100 | #151 | Good 4.6% |
| Immigrants | Africa | 72.5 /100 | #152 | Good 4.6% |
| Immigrants | Uruguay | 72.5 /100 | #153 | Good 4.6% |
Demographics Similar to Lithuanians by Professional Degree
In terms of professional degree, the demographic groups most similar to Lithuanians are Immigrants from Romania (5.4%, a difference of 0.10%), Ethiopian (5.4%, a difference of 0.47%), Immigrants from Western Asia (5.4%, a difference of 0.48%), Immigrants from Indonesia (5.3%, a difference of 0.61%), and Immigrants from Canada (5.3%, a difference of 0.69%).
| Demographics | Rating | Rank | Professional Degree |
| Immigrants | Bolivia | 99.9 /100 | #65 | Exceptional 5.5% |
| Immigrants | Kazakhstan | 99.9 /100 | #66 | Exceptional 5.5% |
| Immigrants | Bulgaria | 99.9 /100 | #67 | Exceptional 5.5% |
| Immigrants | Lebanon | 99.9 /100 | #68 | Exceptional 5.5% |
| Immigrants | Hungary | 99.9 /100 | #69 | Exceptional 5.5% |
| Bhutanese | 99.8 /100 | #70 | Exceptional 5.4% |
| Immigrants | Western Asia | 99.8 /100 | #71 | Exceptional 5.4% |
| Lithuanians | 99.8 /100 | #72 | Exceptional 5.4% |
| Immigrants | Romania | 99.8 /100 | #73 | Exceptional 5.4% |
| Ethiopians | 99.7 /100 | #74 | Exceptional 5.4% |
| Immigrants | Indonesia | 99.7 /100 | #75 | Exceptional 5.3% |
| Immigrants | Canada | 99.7 /100 | #76 | Exceptional 5.3% |
| Immigrants | Ethiopia | 99.7 /100 | #77 | Exceptional 5.3% |
| Armenians | 99.7 /100 | #78 | Exceptional 5.3% |
| Immigrants | North America | 99.7 /100 | #79 | Exceptional 5.3% |