Delaware vs Marshallese Professional Degree
COMPARE
Delaware
Marshallese
Professional Degree
Professional Degree Comparison
Delaware
Marshallese
3.6%
PROFESSIONAL DEGREE
0.7/ 100
METRIC RATING
267th/ 347
METRIC RANK
3.8%
PROFESSIONAL DEGREE
1.7/ 100
METRIC RATING
246th/ 347
METRIC RANK
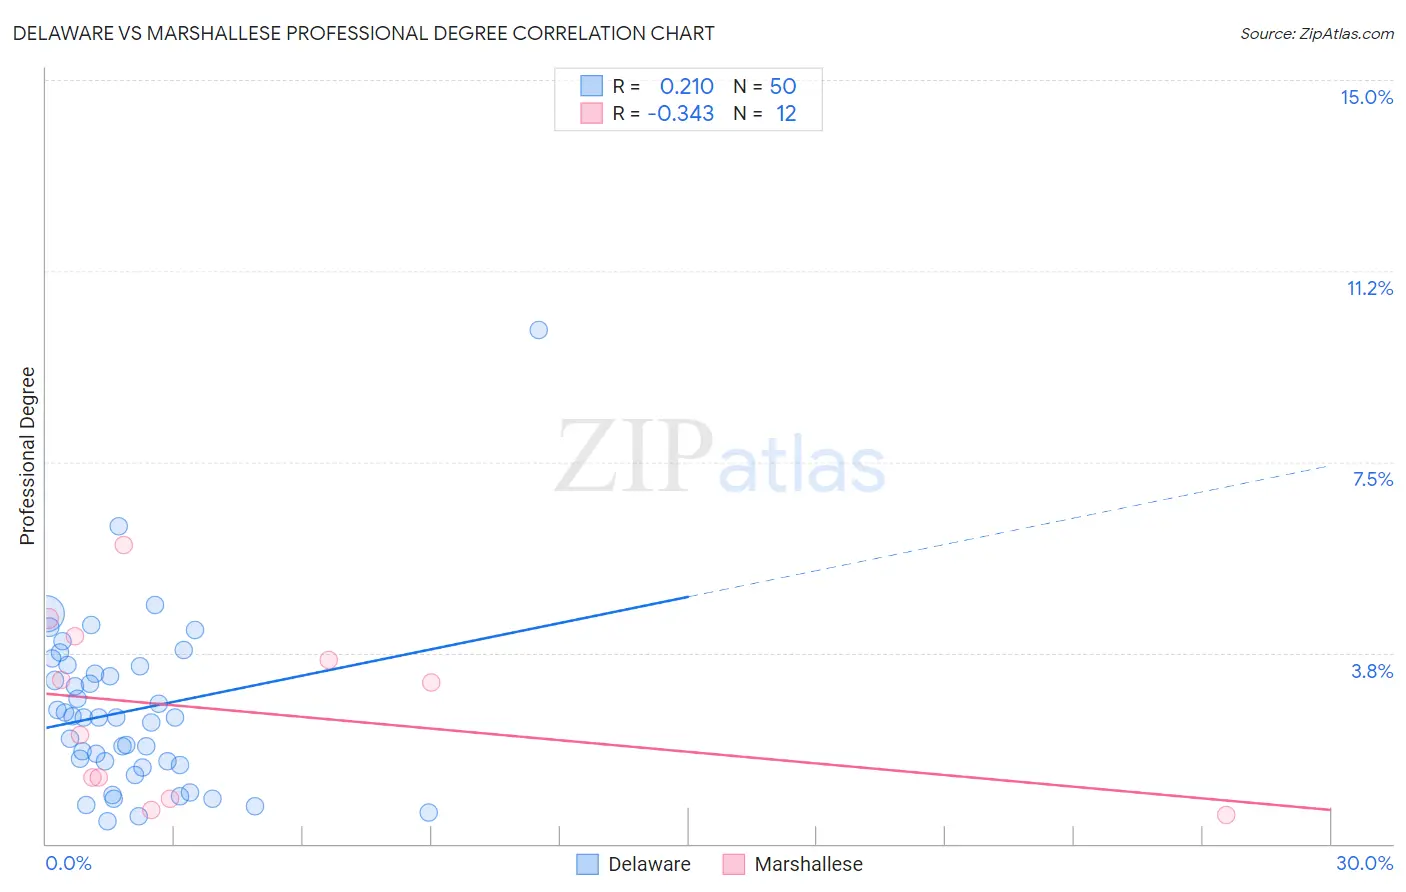
Delaware vs Marshallese Professional Degree Correlation Chart
The statistical analysis conducted on geographies consisting of 96,092,765 people shows a weak positive correlation between the proportion of Delaware and percentage of population with at least professional degree education in the United States with a correlation coefficient (R) of 0.210 and weighted average of 3.6%. Similarly, the statistical analysis conducted on geographies consisting of 14,750,149 people shows a mild negative correlation between the proportion of Marshallese and percentage of population with at least professional degree education in the United States with a correlation coefficient (R) of -0.343 and weighted average of 3.8%, a difference of 3.6%.
Professional Degree Correlation Summary
| Measurement | Delaware | Marshallese |
| Minimum | 0.44% | 0.57% |
| Maximum | 10.1% | 5.9% |
| Range | 9.6% | 5.3% |
| Mean | 2.6% | 2.6% |
| Median | 2.5% | 2.6% |
| Interquartile 25% (IQ1) | 1.5% | 1.1% |
| Interquartile 75% (IQ3) | 3.5% | 3.8% |
| Interquartile Range (IQR) | 1.9% | 2.8% |
| Standard Deviation (Sample) | 1.7% | 1.7% |
| Standard Deviation (Population) | 1.7% | 1.6% |
Similar Demographics by Professional Degree
Demographics Similar to Delaware by Professional Degree
In terms of professional degree, the demographic groups most similar to Delaware are Aleut (3.6%, a difference of 0.15%), Central American Indian (3.6%, a difference of 0.26%), Immigrants from Congo (3.6%, a difference of 0.58%), Immigrants from Cambodia (3.6%, a difference of 0.63%), and Hopi (3.6%, a difference of 0.64%).
| Demographics | Rating | Rank | Professional Degree |
| Indonesians | 1.0 /100 | #260 | Tragic 3.7% |
| Immigrants | Guyana | 1.0 /100 | #261 | Tragic 3.7% |
| U.S. Virgin Islanders | 1.0 /100 | #262 | Tragic 3.7% |
| Hopi | 0.9 /100 | #263 | Tragic 3.6% |
| Immigrants | Cambodia | 0.9 /100 | #264 | Tragic 3.6% |
| Immigrants | Congo | 0.8 /100 | #265 | Tragic 3.6% |
| Central American Indians | 0.8 /100 | #266 | Tragic 3.6% |
| Delaware | 0.7 /100 | #267 | Tragic 3.6% |
| Aleuts | 0.7 /100 | #268 | Tragic 3.6% |
| Immigrants | Cuba | 0.6 /100 | #269 | Tragic 3.6% |
| Central Americans | 0.6 /100 | #270 | Tragic 3.6% |
| Belizeans | 0.5 /100 | #271 | Tragic 3.6% |
| Immigrants | Jamaica | 0.5 /100 | #272 | Tragic 3.6% |
| Americans | 0.5 /100 | #273 | Tragic 3.6% |
| Potawatomi | 0.5 /100 | #274 | Tragic 3.6% |
Demographics Similar to Marshallese by Professional Degree
In terms of professional degree, the demographic groups most similar to Marshallese are Guyanese (3.8%, a difference of 0.020%), French American Indian (3.8%, a difference of 0.17%), Hmong (3.7%, a difference of 0.18%), Immigrants from Grenada (3.7%, a difference of 0.30%), and Immigrants from Fiji (3.7%, a difference of 0.36%).
| Demographics | Rating | Rank | Professional Degree |
| British West Indians | 2.4 /100 | #239 | Tragic 3.8% |
| Immigrants | Ecuador | 2.3 /100 | #240 | Tragic 3.8% |
| Alaskan Athabascans | 2.3 /100 | #241 | Tragic 3.8% |
| Native Hawaiians | 2.3 /100 | #242 | Tragic 3.8% |
| Guamanians/Chamorros | 2.2 /100 | #243 | Tragic 3.8% |
| Immigrants | Bahamas | 2.0 /100 | #244 | Tragic 3.8% |
| French American Indians | 1.7 /100 | #245 | Tragic 3.8% |
| Marshallese | 1.7 /100 | #246 | Tragic 3.8% |
| Guyanese | 1.6 /100 | #247 | Tragic 3.8% |
| Hmong | 1.6 /100 | #248 | Tragic 3.7% |
| Immigrants | Grenada | 1.5 /100 | #249 | Tragic 3.7% |
| Immigrants | Fiji | 1.5 /100 | #250 | Tragic 3.7% |
| Immigrants | Nicaragua | 1.4 /100 | #251 | Tragic 3.7% |
| Jamaicans | 1.4 /100 | #252 | Tragic 3.7% |
| Pueblo | 1.4 /100 | #253 | Tragic 3.7% |