Czechoslovakian vs Marshallese Professional Degree
COMPARE
Czechoslovakian
Marshallese
Professional Degree
Professional Degree Comparison
Czechoslovakians
Marshallese
4.2%
PROFESSIONAL DEGREE
22.4/ 100
METRIC RATING
197th/ 347
METRIC RANK
3.8%
PROFESSIONAL DEGREE
1.7/ 100
METRIC RATING
246th/ 347
METRIC RANK
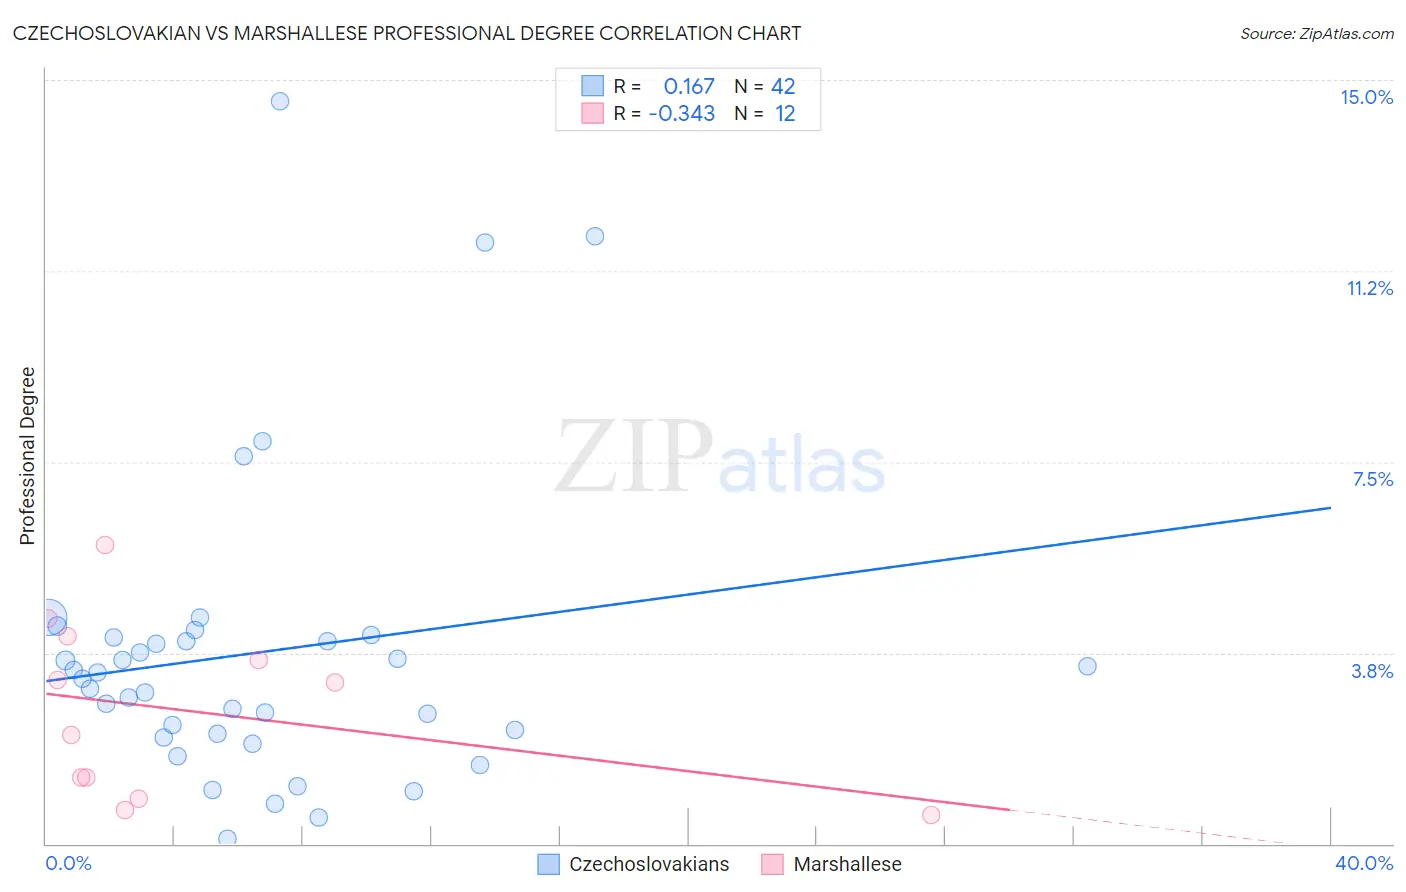
Czechoslovakian vs Marshallese Professional Degree Correlation Chart
The statistical analysis conducted on geographies consisting of 367,571,969 people shows a poor positive correlation between the proportion of Czechoslovakians and percentage of population with at least professional degree education in the United States with a correlation coefficient (R) of 0.167 and weighted average of 4.2%. Similarly, the statistical analysis conducted on geographies consisting of 14,750,149 people shows a mild negative correlation between the proportion of Marshallese and percentage of population with at least professional degree education in the United States with a correlation coefficient (R) of -0.343 and weighted average of 3.8%, a difference of 12.1%.
Professional Degree Correlation Summary
| Measurement | Czechoslovakian | Marshallese |
| Minimum | 0.10% | 0.57% |
| Maximum | 14.6% | 5.9% |
| Range | 14.5% | 5.3% |
| Mean | 3.7% | 2.6% |
| Median | 3.3% | 2.6% |
| Interquartile 25% (IQ1) | 2.2% | 1.1% |
| Interquartile 75% (IQ3) | 4.0% | 3.8% |
| Interquartile Range (IQR) | 1.9% | 2.8% |
| Standard Deviation (Sample) | 3.0% | 1.7% |
| Standard Deviation (Population) | 3.0% | 1.6% |
Similar Demographics by Professional Degree
Demographics Similar to Czechoslovakians by Professional Degree
In terms of professional degree, the demographic groups most similar to Czechoslovakians are Immigrants from Middle Africa (4.2%, a difference of 0.050%), Spanish (4.2%, a difference of 0.14%), Norwegian (4.2%, a difference of 0.42%), Nigerian (4.2%, a difference of 0.47%), and Immigrants from North Macedonia (4.2%, a difference of 0.50%).
| Demographics | Rating | Rank | Professional Degree |
| Immigrants | Poland | 29.2 /100 | #190 | Fair 4.3% |
| Sri Lankans | 29.0 /100 | #191 | Fair 4.3% |
| Ghanaians | 27.3 /100 | #192 | Fair 4.3% |
| French | 27.1 /100 | #193 | Fair 4.2% |
| Scandinavians | 25.8 /100 | #194 | Fair 4.2% |
| Nigerians | 24.6 /100 | #195 | Fair 4.2% |
| Spanish | 23.0 /100 | #196 | Fair 4.2% |
| Czechoslovakians | 22.4 /100 | #197 | Fair 4.2% |
| Immigrants | Middle Africa | 22.1 /100 | #198 | Fair 4.2% |
| Norwegians | 20.5 /100 | #199 | Fair 4.2% |
| Immigrants | North Macedonia | 20.2 /100 | #200 | Fair 4.2% |
| Finns | 18.7 /100 | #201 | Poor 4.2% |
| Immigrants | Iraq | 17.1 /100 | #202 | Poor 4.2% |
| Panamanians | 15.9 /100 | #203 | Poor 4.1% |
| Barbadians | 15.8 /100 | #204 | Poor 4.1% |
Demographics Similar to Marshallese by Professional Degree
In terms of professional degree, the demographic groups most similar to Marshallese are Guyanese (3.8%, a difference of 0.020%), French American Indian (3.8%, a difference of 0.17%), Hmong (3.7%, a difference of 0.18%), Immigrants from Grenada (3.7%, a difference of 0.30%), and Immigrants from Fiji (3.7%, a difference of 0.36%).
| Demographics | Rating | Rank | Professional Degree |
| British West Indians | 2.4 /100 | #239 | Tragic 3.8% |
| Immigrants | Ecuador | 2.3 /100 | #240 | Tragic 3.8% |
| Alaskan Athabascans | 2.3 /100 | #241 | Tragic 3.8% |
| Native Hawaiians | 2.3 /100 | #242 | Tragic 3.8% |
| Guamanians/Chamorros | 2.2 /100 | #243 | Tragic 3.8% |
| Immigrants | Bahamas | 2.0 /100 | #244 | Tragic 3.8% |
| French American Indians | 1.7 /100 | #245 | Tragic 3.8% |
| Marshallese | 1.7 /100 | #246 | Tragic 3.8% |
| Guyanese | 1.6 /100 | #247 | Tragic 3.8% |
| Hmong | 1.6 /100 | #248 | Tragic 3.7% |
| Immigrants | Grenada | 1.5 /100 | #249 | Tragic 3.7% |
| Immigrants | Fiji | 1.5 /100 | #250 | Tragic 3.7% |
| Immigrants | Nicaragua | 1.4 /100 | #251 | Tragic 3.7% |
| Jamaicans | 1.4 /100 | #252 | Tragic 3.7% |
| Pueblo | 1.4 /100 | #253 | Tragic 3.7% |