Bahamian vs Immigrants from Uruguay Doctorate Degree
COMPARE
Bahamian
Immigrants from Uruguay
Doctorate Degree
Doctorate Degree Comparison
Bahamians
Immigrants from Uruguay
1.5%
DOCTORATE DEGREE
0.4/ 100
METRIC RATING
277th/ 347
METRIC RANK
1.7%
DOCTORATE DEGREE
9.2/ 100
METRIC RATING
220th/ 347
METRIC RANK
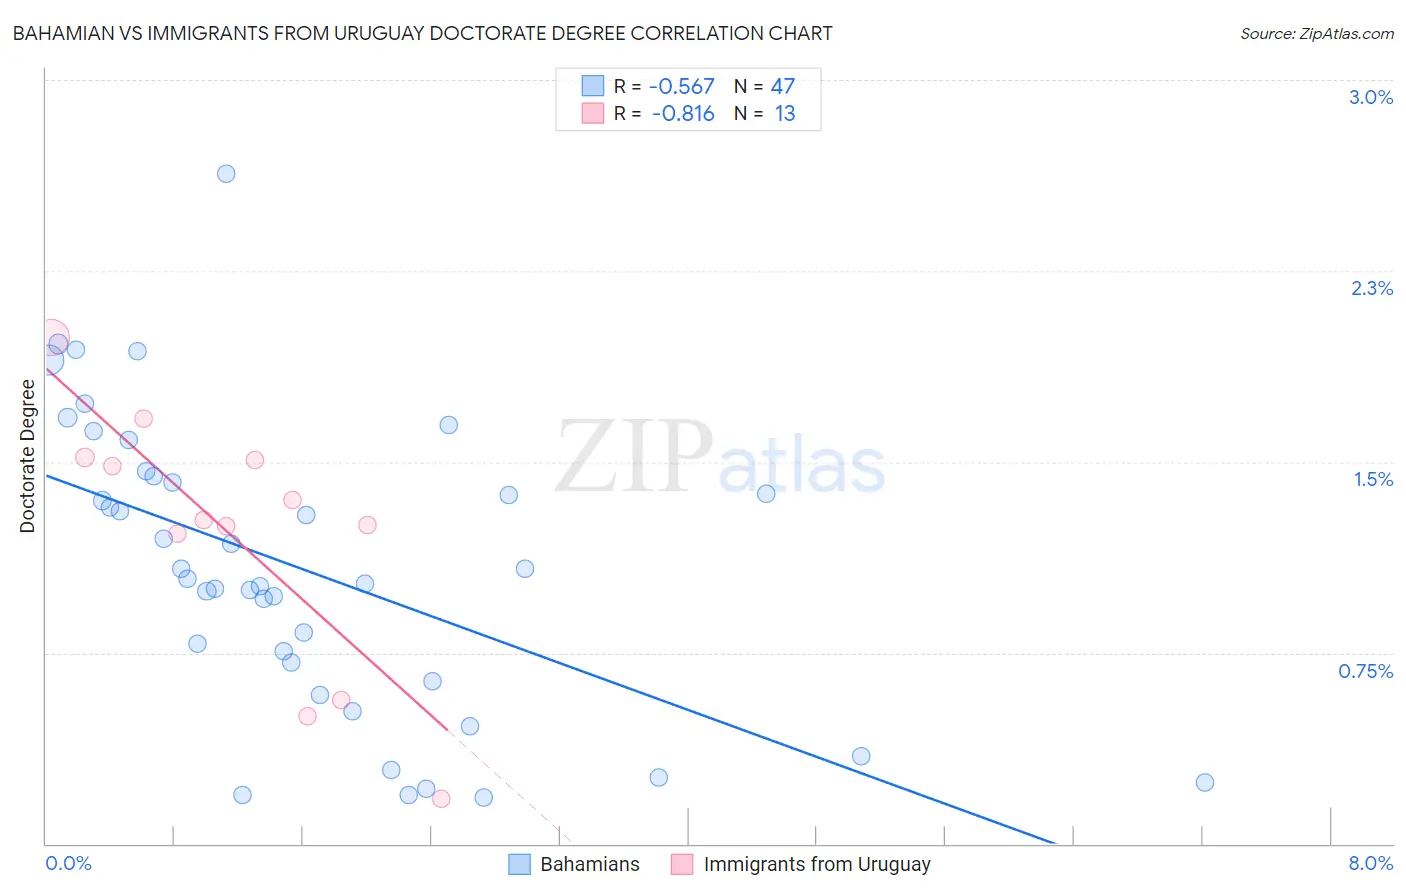
Bahamian vs Immigrants from Uruguay Doctorate Degree Correlation Chart
The statistical analysis conducted on geographies consisting of 112,287,589 people shows a substantial negative correlation between the proportion of Bahamians and percentage of population with at least doctorate degree education in the United States with a correlation coefficient (R) of -0.567 and weighted average of 1.5%. Similarly, the statistical analysis conducted on geographies consisting of 133,064,072 people shows a very strong negative correlation between the proportion of Immigrants from Uruguay and percentage of population with at least doctorate degree education in the United States with a correlation coefficient (R) of -0.816 and weighted average of 1.7%, a difference of 15.1%.
Doctorate Degree Correlation Summary
| Measurement | Bahamian | Immigrants from Uruguay |
| Minimum | 0.18% | 0.18% |
| Maximum | 2.6% | 2.0% |
| Range | 2.5% | 1.8% |
| Mean | 1.1% | 1.2% |
| Median | 1.0% | 1.3% |
| Interquartile 25% (IQ1) | 0.64% | 0.89% |
| Interquartile 75% (IQ3) | 1.4% | 1.5% |
| Interquartile Range (IQR) | 0.80% | 0.62% |
| Standard Deviation (Sample) | 0.57% | 0.51% |
| Standard Deviation (Population) | 0.57% | 0.49% |
Similar Demographics by Doctorate Degree
Demographics Similar to Bahamians by Doctorate Degree
In terms of doctorate degree, the demographic groups most similar to Bahamians are Hawaiian (1.5%, a difference of 0.060%), Marshallese (1.5%, a difference of 0.28%), Ecuadorian (1.5%, a difference of 0.29%), Tohono O'odham (1.5%, a difference of 0.35%), and British West Indian (1.5%, a difference of 0.41%).
| Demographics | Rating | Rank | Doctorate Degree |
| Salvadorans | 0.5 /100 | #270 | Tragic 1.5% |
| Immigrants | Trinidad and Tobago | 0.5 /100 | #271 | Tragic 1.5% |
| Immigrants | Barbados | 0.4 /100 | #272 | Tragic 1.5% |
| Sioux | 0.4 /100 | #273 | Tragic 1.5% |
| Yaqui | 0.4 /100 | #274 | Tragic 1.5% |
| Aleuts | 0.4 /100 | #275 | Tragic 1.5% |
| Paiute | 0.4 /100 | #276 | Tragic 1.5% |
| Bahamians | 0.4 /100 | #277 | Tragic 1.5% |
| Hawaiians | 0.4 /100 | #278 | Tragic 1.5% |
| Marshallese | 0.4 /100 | #279 | Tragic 1.5% |
| Ecuadorians | 0.4 /100 | #280 | Tragic 1.5% |
| Tohono O'odham | 0.4 /100 | #281 | Tragic 1.5% |
| British West Indians | 0.3 /100 | #282 | Tragic 1.5% |
| Central Americans | 0.3 /100 | #283 | Tragic 1.5% |
| Jamaicans | 0.3 /100 | #284 | Tragic 1.5% |
Demographics Similar to Immigrants from Uruguay by Doctorate Degree
In terms of doctorate degree, the demographic groups most similar to Immigrants from Uruguay are Nonimmigrants (1.7%, a difference of 0.19%), Immigrants from Venezuela (1.7%, a difference of 0.26%), Immigrants from Iraq (1.7%, a difference of 0.66%), Immigrants from Bosnia and Herzegovina (1.7%, a difference of 0.72%), and Immigrants from Poland (1.7%, a difference of 0.94%).
| Demographics | Rating | Rank | Doctorate Degree |
| Koreans | 14.2 /100 | #213 | Poor 1.7% |
| Pueblo | 14.2 /100 | #214 | Poor 1.7% |
| Alaskan Athabascans | 13.8 /100 | #215 | Poor 1.7% |
| Immigrants | Burma/Myanmar | 13.5 /100 | #216 | Poor 1.7% |
| Spanish Americans | 12.9 /100 | #217 | Poor 1.7% |
| Tlingit-Haida | 11.9 /100 | #218 | Poor 1.7% |
| Immigrants | Iraq | 10.7 /100 | #219 | Poor 1.7% |
| Immigrants | Uruguay | 9.2 /100 | #220 | Tragic 1.7% |
| Immigrants | Nonimmigrants | 8.8 /100 | #221 | Tragic 1.7% |
| Immigrants | Venezuela | 8.7 /100 | #222 | Tragic 1.7% |
| Immigrants | Bosnia and Herzegovina | 7.8 /100 | #223 | Tragic 1.7% |
| Immigrants | Poland | 7.4 /100 | #224 | Tragic 1.7% |
| Immigrants | Colombia | 6.7 /100 | #225 | Tragic 1.7% |
| Osage | 6.5 /100 | #226 | Tragic 1.7% |
| Panamanians | 6.3 /100 | #227 | Tragic 1.7% |