Italian vs Immigrants from Uganda Kindergarten
COMPARE
Italian
Immigrants from Uganda
Kindergarten
Kindergarten Comparison
Italians
Immigrants from Uganda
98.5%
KINDERGARTEN
99.9/ 100
METRIC RATING
37th/ 347
METRIC RANK
97.8%
KINDERGARTEN
18.8/ 100
METRIC RATING
203rd/ 347
METRIC RANK
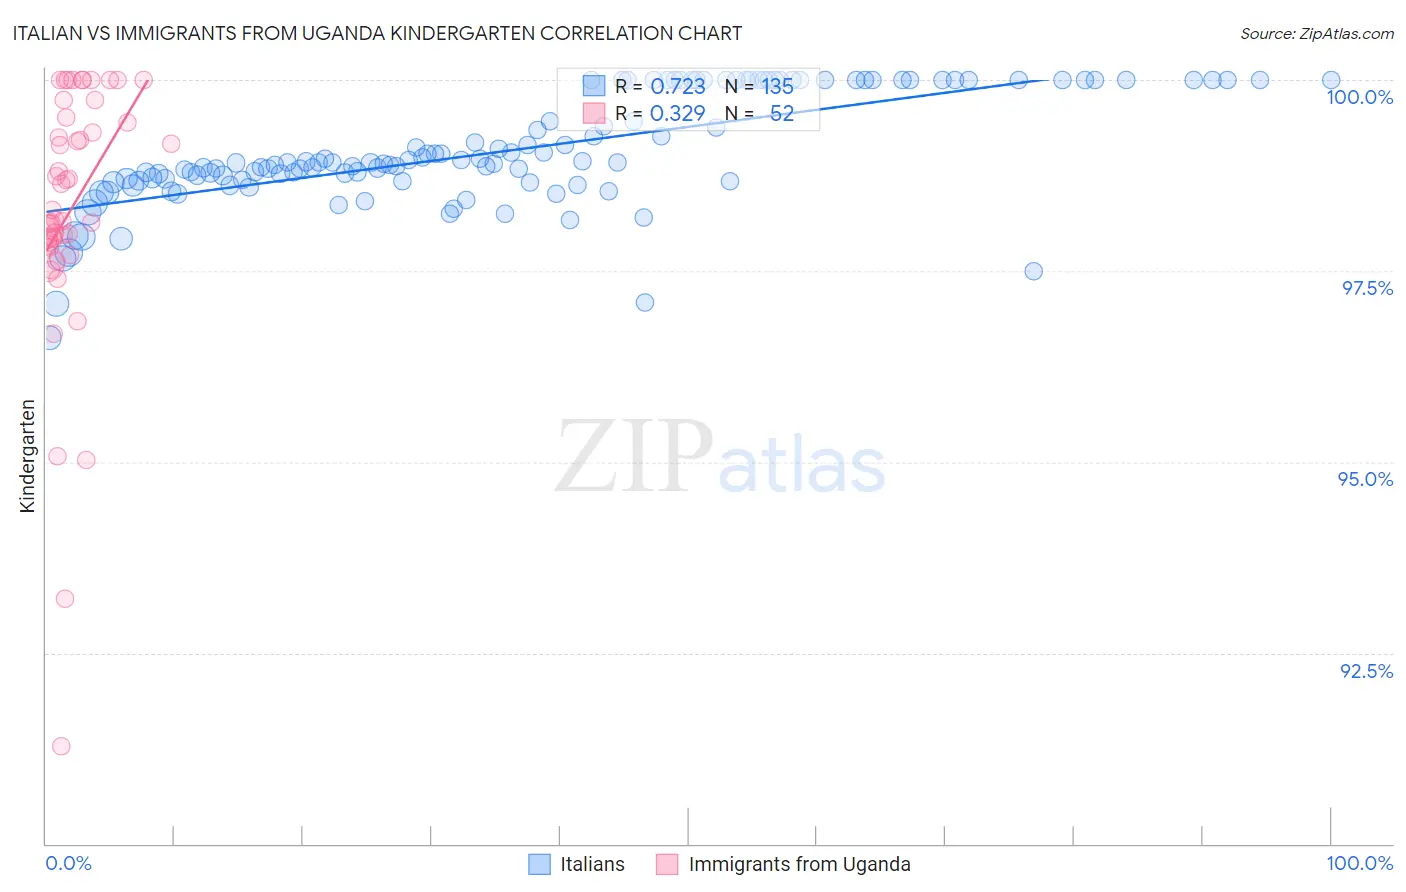
Italian vs Immigrants from Uganda Kindergarten Correlation Chart
The statistical analysis conducted on geographies consisting of 575,115,824 people shows a strong positive correlation between the proportion of Italians and percentage of population with at least kindergarten education in the United States with a correlation coefficient (R) of 0.723 and weighted average of 98.5%. Similarly, the statistical analysis conducted on geographies consisting of 125,941,298 people shows a mild positive correlation between the proportion of Immigrants from Uganda and percentage of population with at least kindergarten education in the United States with a correlation coefficient (R) of 0.329 and weighted average of 97.8%, a difference of 0.68%.
Kindergarten Correlation Summary
| Measurement | Italian | Immigrants from Uganda |
| Minimum | 96.6% | 91.3% |
| Maximum | 100.0% | 100.0% |
| Range | 3.4% | 8.7% |
| Mean | 99.1% | 98.3% |
| Median | 98.9% | 98.2% |
| Interquartile 25% (IQ1) | 98.7% | 97.9% |
| Interquartile 75% (IQ3) | 100.0% | 99.5% |
| Interquartile Range (IQR) | 1.3% | 1.6% |
| Standard Deviation (Sample) | 0.73% | 1.7% |
| Standard Deviation (Population) | 0.72% | 1.7% |
Similar Demographics by Kindergarten
Demographics Similar to Italians by Kindergarten
In terms of kindergarten, the demographic groups most similar to Italians are Latvian (98.5%, a difference of 0.0%), Chippewa (98.5%, a difference of 0.010%), Luxembourger (98.5%, a difference of 0.010%), British (98.5%, a difference of 0.020%), and Eastern European (98.5%, a difference of 0.020%).
| Demographics | Rating | Rank | Kindergarten |
| Europeans | 100.0 /100 | #30 | Exceptional 98.6% |
| Czechs | 100.0 /100 | #31 | Exceptional 98.6% |
| French Canadians | 100.0 /100 | #32 | Exceptional 98.6% |
| Scandinavians | 100.0 /100 | #33 | Exceptional 98.6% |
| Chinese | 100.0 /100 | #34 | Exceptional 98.5% |
| Swiss | 100.0 /100 | #35 | Exceptional 98.5% |
| British | 99.9 /100 | #36 | Exceptional 98.5% |
| Italians | 99.9 /100 | #37 | Exceptional 98.5% |
| Latvians | 99.9 /100 | #38 | Exceptional 98.5% |
| Chippewa | 99.9 /100 | #39 | Exceptional 98.5% |
| Luxembourgers | 99.9 /100 | #40 | Exceptional 98.5% |
| Eastern Europeans | 99.9 /100 | #41 | Exceptional 98.5% |
| Native Hawaiians | 99.9 /100 | #42 | Exceptional 98.5% |
| Lumbee | 99.9 /100 | #43 | Exceptional 98.5% |
| Northern Europeans | 99.9 /100 | #44 | Exceptional 98.5% |
Demographics Similar to Immigrants from Uganda by Kindergarten
In terms of kindergarten, the demographic groups most similar to Immigrants from Uganda are Immigrants from Ukraine (97.8%, a difference of 0.0%), Immigrants from Chile (97.8%, a difference of 0.0%), Immigrants from Southern Europe (97.8%, a difference of 0.0%), Yuman (97.9%, a difference of 0.010%), and Immigrants from Lebanon (97.9%, a difference of 0.010%).
| Demographics | Rating | Rank | Kindergarten |
| Guamanians/Chamorros | 26.2 /100 | #196 | Fair 97.9% |
| Immigrants | Kenya | 25.5 /100 | #197 | Fair 97.9% |
| Tohono O'odham | 24.6 /100 | #198 | Fair 97.9% |
| Immigrants | Egypt | 22.3 /100 | #199 | Fair 97.9% |
| Yuman | 21.6 /100 | #200 | Fair 97.9% |
| Immigrants | Lebanon | 20.9 /100 | #201 | Fair 97.9% |
| Immigrants | Ukraine | 19.1 /100 | #202 | Poor 97.8% |
| Immigrants | Uganda | 18.8 /100 | #203 | Poor 97.8% |
| Immigrants | Chile | 18.1 /100 | #204 | Poor 97.8% |
| Immigrants | Southern Europe | 18.0 /100 | #205 | Poor 97.8% |
| Immigrants | Albania | 16.4 /100 | #206 | Poor 97.8% |
| Africans | 16.1 /100 | #207 | Poor 97.8% |
| Immigrants | Northern Africa | 12.0 /100 | #208 | Poor 97.8% |
| Costa Ricans | 11.6 /100 | #209 | Poor 97.8% |
| Immigrants | Oceania | 11.1 /100 | #210 | Poor 97.8% |