Immigrants from Lebanon vs Icelander 2nd Grade
COMPARE
Immigrants from Lebanon
Icelander
2nd Grade
2nd Grade Comparison
Immigrants from Lebanon
Icelanders
97.8%
2ND GRADE
20.9/ 100
METRIC RATING
200th/ 347
METRIC RANK
98.2%
2ND GRADE
99.2/ 100
METRIC RATING
81st/ 347
METRIC RANK
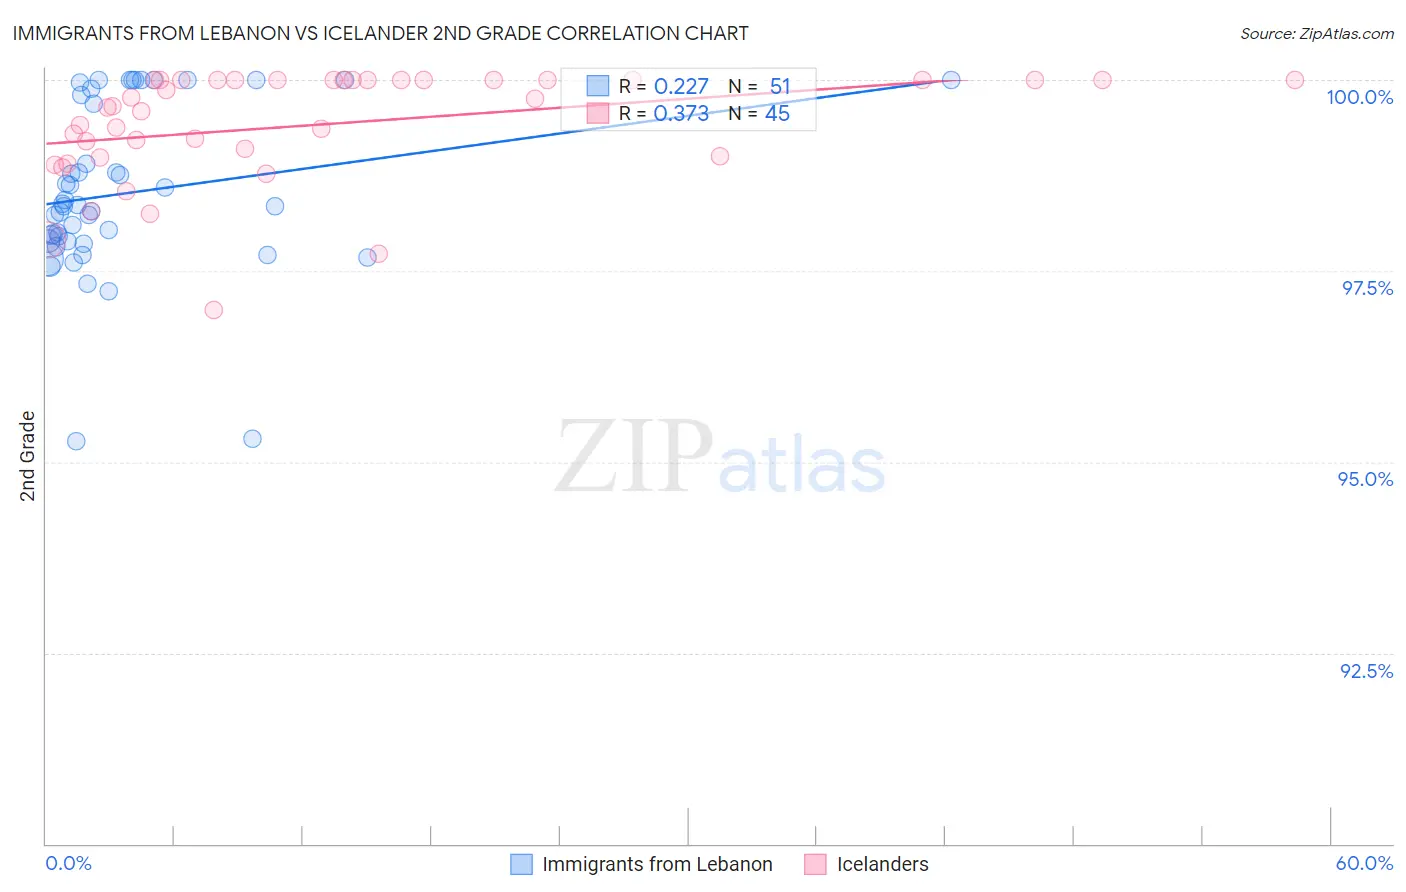
Immigrants from Lebanon vs Icelander 2nd Grade Correlation Chart
The statistical analysis conducted on geographies consisting of 217,102,284 people shows a weak positive correlation between the proportion of Immigrants from Lebanon and percentage of population with at least 2nd grade education in the United States with a correlation coefficient (R) of 0.227 and weighted average of 97.8%. Similarly, the statistical analysis conducted on geographies consisting of 159,668,748 people shows a mild positive correlation between the proportion of Icelanders and percentage of population with at least 2nd grade education in the United States with a correlation coefficient (R) of 0.373 and weighted average of 98.2%, a difference of 0.48%.
2nd Grade Correlation Summary
| Measurement | Immigrants from Lebanon | Icelander |
| Minimum | 95.3% | 97.0% |
| Maximum | 100.0% | 100.0% |
| Range | 4.7% | 3.0% |
| Mean | 98.5% | 99.4% |
| Median | 98.4% | 99.7% |
| Interquartile 25% (IQ1) | 97.9% | 99.0% |
| Interquartile 75% (IQ3) | 99.8% | 100.0% |
| Interquartile Range (IQR) | 1.9% | 1.0% |
| Standard Deviation (Sample) | 1.1% | 0.73% |
| Standard Deviation (Population) | 1.1% | 0.72% |
Similar Demographics by 2nd Grade
Demographics Similar to Immigrants from Lebanon by 2nd Grade
In terms of 2nd grade, the demographic groups most similar to Immigrants from Lebanon are Tohono O'odham (97.8%, a difference of 0.0%), Immigrants from Ukraine (97.8%, a difference of 0.0%), Yuman (97.8%, a difference of 0.0%), Immigrants from Albania (97.8%, a difference of 0.010%), and Immigrants from Southern Europe (97.8%, a difference of 0.010%).
| Demographics | Rating | Rank | 2nd Grade |
| Hawaiians | 28.5 /100 | #193 | Fair 97.8% |
| Paiute | 27.0 /100 | #194 | Fair 97.8% |
| Mongolians | 26.7 /100 | #195 | Fair 97.8% |
| Immigrants | Kenya | 26.4 /100 | #196 | Fair 97.8% |
| Immigrants | Uganda | 26.3 /100 | #197 | Fair 97.8% |
| Guamanians/Chamorros | 25.7 /100 | #198 | Fair 97.8% |
| Immigrants | Egypt | 24.4 /100 | #199 | Fair 97.8% |
| Immigrants | Lebanon | 20.9 /100 | #200 | Fair 97.8% |
| Tohono O'odham | 20.9 /100 | #201 | Fair 97.8% |
| Immigrants | Ukraine | 20.5 /100 | #202 | Fair 97.8% |
| Yuman | 20.0 /100 | #203 | Fair 97.8% |
| Immigrants | Albania | 18.4 /100 | #204 | Poor 97.8% |
| Immigrants | Southern Europe | 18.1 /100 | #205 | Poor 97.8% |
| Immigrants | Chile | 17.3 /100 | #206 | Poor 97.7% |
| Africans | 15.6 /100 | #207 | Poor 97.7% |
Demographics Similar to Icelanders by 2nd Grade
In terms of 2nd grade, the demographic groups most similar to Icelanders are Immigrants from Lithuania (98.2%, a difference of 0.010%), Immigrants from Belgium (98.2%, a difference of 0.010%), Osage (98.2%, a difference of 0.010%), Delaware (98.2%, a difference of 0.010%), and Immigrants from Sweden (98.2%, a difference of 0.010%).
| Demographics | Rating | Rank | 2nd Grade |
| Immigrants | Netherlands | 99.4 /100 | #74 | Exceptional 98.3% |
| Shoshone | 99.4 /100 | #75 | Exceptional 98.3% |
| Cherokee | 99.4 /100 | #76 | Exceptional 98.3% |
| Immigrants | England | 99.4 /100 | #77 | Exceptional 98.3% |
| Immigrants | Lithuania | 99.3 /100 | #78 | Exceptional 98.2% |
| Immigrants | Belgium | 99.3 /100 | #79 | Exceptional 98.2% |
| Osage | 99.2 /100 | #80 | Exceptional 98.2% |
| Icelanders | 99.2 /100 | #81 | Exceptional 98.2% |
| Delaware | 99.1 /100 | #82 | Exceptional 98.2% |
| Immigrants | Sweden | 99.1 /100 | #83 | Exceptional 98.2% |
| Hopi | 99.1 /100 | #84 | Exceptional 98.2% |
| Potawatomi | 99.1 /100 | #85 | Exceptional 98.2% |
| Immigrants | Australia | 99.0 /100 | #86 | Exceptional 98.2% |
| Immigrants | Denmark | 99.0 /100 | #87 | Exceptional 98.2% |
| Macedonians | 99.0 /100 | #88 | Exceptional 98.2% |