Immigrants from Thailand vs Dutch Professional Degree
COMPARE
Immigrants from Thailand
Dutch
Professional Degree
Professional Degree Comparison
Immigrants from Thailand
Dutch
4.3%
PROFESSIONAL DEGREE
31.7/ 100
METRIC RATING
188th/ 347
METRIC RANK
4.0%
PROFESSIONAL DEGREE
9.0/ 100
METRIC RATING
218th/ 347
METRIC RANK
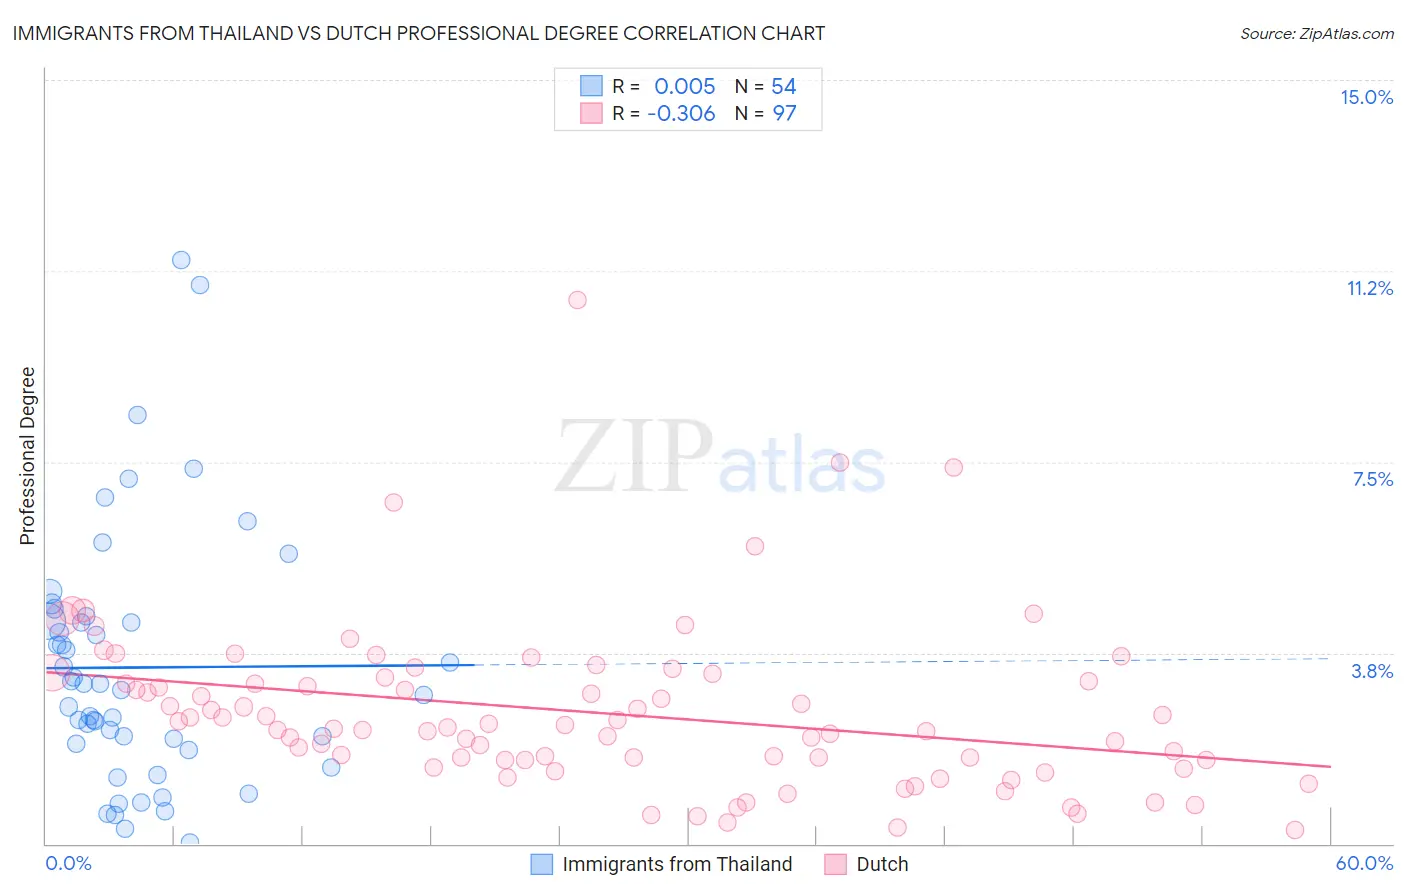
Immigrants from Thailand vs Dutch Professional Degree Correlation Chart
The statistical analysis conducted on geographies consisting of 316,529,517 people shows no correlation between the proportion of Immigrants from Thailand and percentage of population with at least professional degree education in the United States with a correlation coefficient (R) of 0.005 and weighted average of 4.3%. Similarly, the statistical analysis conducted on geographies consisting of 547,430,412 people shows a mild negative correlation between the proportion of Dutch and percentage of population with at least professional degree education in the United States with a correlation coefficient (R) of -0.306 and weighted average of 4.0%, a difference of 6.1%.
Professional Degree Correlation Summary
| Measurement | Immigrants from Thailand | Dutch |
| Minimum | 0.034% | 0.26% |
| Maximum | 11.5% | 10.7% |
| Range | 11.4% | 10.4% |
| Mean | 3.5% | 2.6% |
| Median | 3.1% | 2.3% |
| Interquartile 25% (IQ1) | 2.0% | 1.6% |
| Interquartile 75% (IQ3) | 4.4% | 3.2% |
| Interquartile Range (IQR) | 2.4% | 1.6% |
| Standard Deviation (Sample) | 2.5% | 1.6% |
| Standard Deviation (Population) | 2.4% | 1.6% |
Similar Demographics by Professional Degree
Demographics Similar to Immigrants from Thailand by Professional Degree
In terms of professional degree, the demographic groups most similar to Immigrants from Thailand are Slovak (4.3%, a difference of 0.17%), Immigrants from Cameroon (4.3%, a difference of 0.28%), Scotch-Irish (4.3%, a difference of 0.43%), Immigrants from Poland (4.3%, a difference of 0.44%), and Sri Lankan (4.3%, a difference of 0.47%).
| Demographics | Rating | Rank | Professional Degree |
| Danes | 43.5 /100 | #181 | Average 4.4% |
| Immigrants | Immigrants | 43.2 /100 | #182 | Average 4.4% |
| Bermudans | 43.1 /100 | #183 | Average 4.4% |
| Belgians | 36.2 /100 | #184 | Fair 4.3% |
| Welsh | 35.8 /100 | #185 | Fair 4.3% |
| Scotch-Irish | 34.2 /100 | #186 | Fair 4.3% |
| Immigrants | Cameroon | 33.3 /100 | #187 | Fair 4.3% |
| Immigrants | Thailand | 31.7 /100 | #188 | Fair 4.3% |
| Slovaks | 30.7 /100 | #189 | Fair 4.3% |
| Immigrants | Poland | 29.2 /100 | #190 | Fair 4.3% |
| Sri Lankans | 29.0 /100 | #191 | Fair 4.3% |
| Ghanaians | 27.3 /100 | #192 | Fair 4.3% |
| French | 27.1 /100 | #193 | Fair 4.2% |
| Scandinavians | 25.8 /100 | #194 | Fair 4.2% |
| Nigerians | 24.6 /100 | #195 | Fair 4.2% |
Demographics Similar to Dutch by Professional Degree
In terms of professional degree, the demographic groups most similar to Dutch are Immigrants from South Eastern Asia (4.0%, a difference of 0.030%), Immigrants from Vietnam (4.0%, a difference of 0.21%), West Indian (4.1%, a difference of 0.37%), Ute (4.0%, a difference of 0.39%), and French Canadian (4.0%, a difference of 0.52%).
| Demographics | Rating | Rank | Professional Degree |
| Germans | 11.6 /100 | #211 | Poor 4.1% |
| Whites/Caucasians | 11.2 /100 | #212 | Poor 4.1% |
| Koreans | 10.7 /100 | #213 | Poor 4.1% |
| Immigrants | Ghana | 10.6 /100 | #214 | Poor 4.1% |
| Portuguese | 10.5 /100 | #215 | Poor 4.1% |
| West Indians | 9.8 /100 | #216 | Tragic 4.1% |
| Immigrants | Vietnam | 9.4 /100 | #217 | Tragic 4.0% |
| Dutch | 9.0 /100 | #218 | Tragic 4.0% |
| Immigrants | South Eastern Asia | 8.9 /100 | #219 | Tragic 4.0% |
| Ute | 8.2 /100 | #220 | Tragic 4.0% |
| French Canadians | 8.0 /100 | #221 | Tragic 4.0% |
| Immigrants | Western Africa | 7.5 /100 | #222 | Tragic 4.0% |
| Immigrants | Bosnia and Herzegovina | 7.4 /100 | #223 | Tragic 4.0% |
| Trinidadians and Tobagonians | 7.1 /100 | #224 | Tragic 4.0% |
| Tlingit-Haida | 6.9 /100 | #225 | Tragic 4.0% |