Immigrants from Liberia vs Yugoslavian 5th Grade
COMPARE
Immigrants from Liberia
Yugoslavian
5th Grade
5th Grade Comparison
Immigrants from Liberia
Yugoslavians
96.9%
5TH GRADE
1.0/ 100
METRIC RATING
250th/ 347
METRIC RANK
97.7%
5TH GRADE
98.3/ 100
METRIC RATING
98th/ 347
METRIC RANK
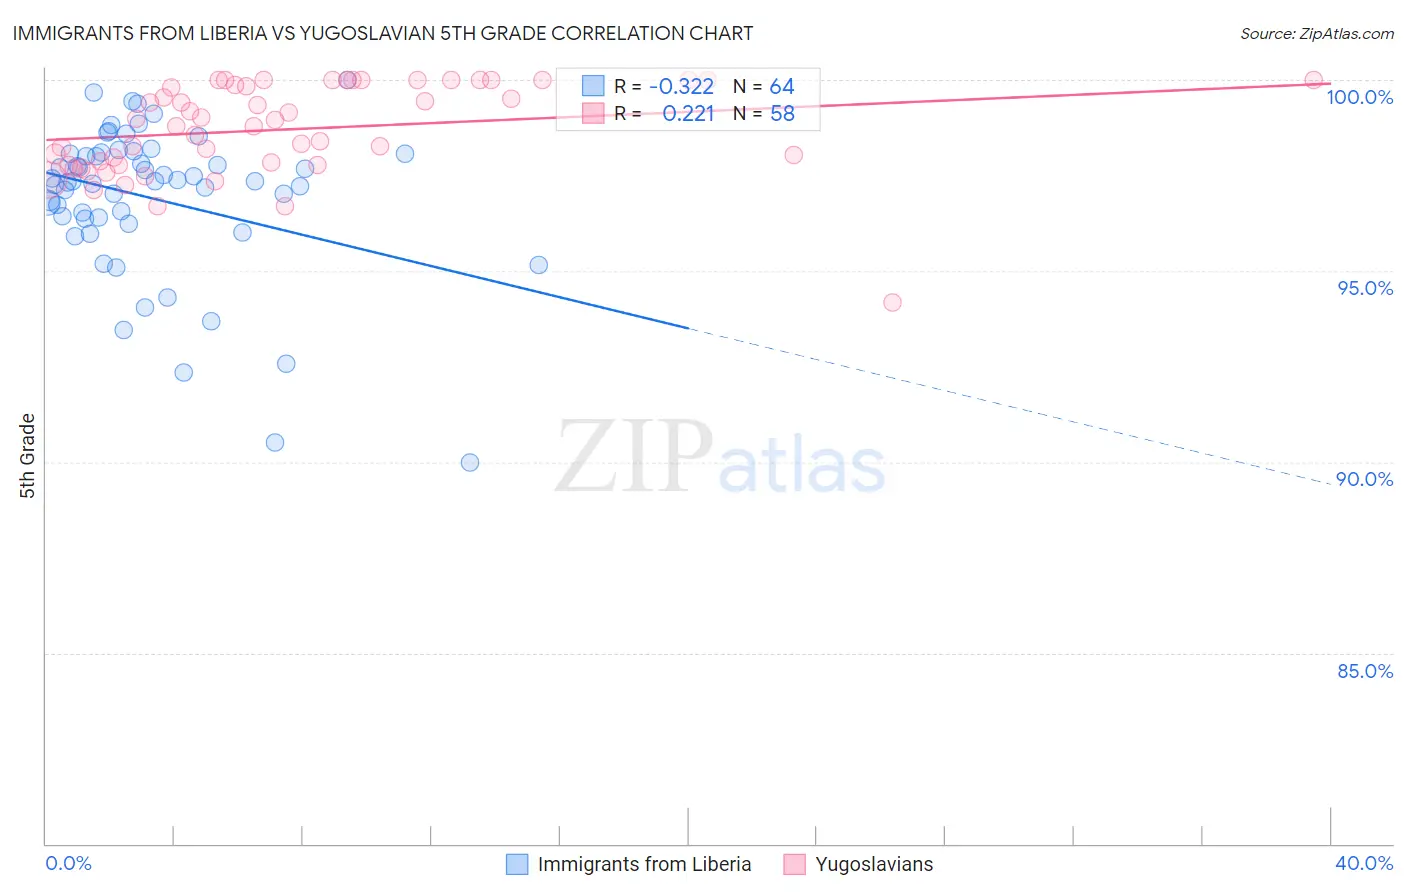
Immigrants from Liberia vs Yugoslavian 5th Grade Correlation Chart
The statistical analysis conducted on geographies consisting of 135,294,272 people shows a mild negative correlation between the proportion of Immigrants from Liberia and percentage of population with at least 5th grade education in the United States with a correlation coefficient (R) of -0.322 and weighted average of 96.9%. Similarly, the statistical analysis conducted on geographies consisting of 285,618,157 people shows a weak positive correlation between the proportion of Yugoslavians and percentage of population with at least 5th grade education in the United States with a correlation coefficient (R) of 0.221 and weighted average of 97.7%, a difference of 0.91%.
5th Grade Correlation Summary
| Measurement | Immigrants from Liberia | Yugoslavian |
| Minimum | 90.0% | 94.2% |
| Maximum | 100.0% | 100.0% |
| Range | 10.0% | 5.8% |
| Mean | 96.9% | 98.7% |
| Median | 97.4% | 98.9% |
| Interquartile 25% (IQ1) | 96.4% | 97.8% |
| Interquartile 75% (IQ3) | 98.1% | 100.0% |
| Interquartile Range (IQR) | 1.7% | 2.2% |
| Standard Deviation (Sample) | 2.0% | 1.2% |
| Standard Deviation (Population) | 2.0% | 1.2% |
Similar Demographics by 5th Grade
Demographics Similar to Immigrants from Liberia by 5th Grade
In terms of 5th grade, the demographic groups most similar to Immigrants from Liberia are Immigrants from Uruguay (96.9%, a difference of 0.0%), Bolivian (96.9%, a difference of 0.0%), Immigrants from Africa (96.9%, a difference of 0.010%), U.S. Virgin Islander (96.9%, a difference of 0.010%), and Jamaican (96.9%, a difference of 0.010%).
| Demographics | Rating | Rank | 5th Grade |
| Immigrants | Eastern Africa | 1.6 /100 | #243 | Tragic 96.9% |
| Koreans | 1.6 /100 | #244 | Tragic 96.9% |
| Colombians | 1.3 /100 | #245 | Tragic 96.9% |
| Ethiopians | 1.2 /100 | #246 | Tragic 96.9% |
| Immigrants | Africa | 1.1 /100 | #247 | Tragic 96.9% |
| U.S. Virgin Islanders | 1.1 /100 | #248 | Tragic 96.9% |
| Immigrants | Uruguay | 1.0 /100 | #249 | Tragic 96.9% |
| Immigrants | Liberia | 1.0 /100 | #250 | Tragic 96.9% |
| Bolivians | 0.9 /100 | #251 | Tragic 96.9% |
| Jamaicans | 0.9 /100 | #252 | Tragic 96.9% |
| Immigrants | Middle Africa | 0.8 /100 | #253 | Tragic 96.8% |
| Immigrants | Senegal | 0.8 /100 | #254 | Tragic 96.8% |
| South Americans | 0.7 /100 | #255 | Tragic 96.8% |
| Immigrants | Congo | 0.7 /100 | #256 | Tragic 96.8% |
| Peruvians | 0.6 /100 | #257 | Tragic 96.8% |
Demographics Similar to Yugoslavians by 5th Grade
In terms of 5th grade, the demographic groups most similar to Yugoslavians are Turkish (97.7%, a difference of 0.0%), Puget Sound Salish (97.7%, a difference of 0.0%), South African (97.7%, a difference of 0.0%), Immigrants from Germany (97.8%, a difference of 0.010%), and Cree (97.7%, a difference of 0.010%).
| Demographics | Rating | Rank | 5th Grade |
| Immigrants | Western Europe | 98.8 /100 | #91 | Exceptional 97.8% |
| Immigrants | Sweden | 98.7 /100 | #92 | Exceptional 97.8% |
| Delaware | 98.6 /100 | #93 | Exceptional 97.8% |
| Immigrants | Denmark | 98.6 /100 | #94 | Exceptional 97.8% |
| Romanians | 98.6 /100 | #95 | Exceptional 97.8% |
| Immigrants | Germany | 98.5 /100 | #96 | Exceptional 97.8% |
| Cree | 98.4 /100 | #97 | Exceptional 97.7% |
| Yugoslavians | 98.3 /100 | #98 | Exceptional 97.7% |
| Turks | 98.3 /100 | #99 | Exceptional 97.7% |
| Puget Sound Salish | 98.3 /100 | #100 | Exceptional 97.7% |
| South Africans | 98.3 /100 | #101 | Exceptional 97.7% |
| Choctaw | 98.0 /100 | #102 | Exceptional 97.7% |
| Cheyenne | 97.9 /100 | #103 | Exceptional 97.7% |
| German Russians | 97.8 /100 | #104 | Exceptional 97.7% |
| Bhutanese | 97.6 /100 | #105 | Exceptional 97.7% |