Sioux vs Yugoslavian 5th Grade
COMPARE
Sioux
Yugoslavian
5th Grade
5th Grade Comparison
Sioux
Yugoslavians
98.2%
5TH GRADE
100.0/ 100
METRIC RATING
23rd/ 347
METRIC RANK
97.7%
5TH GRADE
98.3/ 100
METRIC RATING
98th/ 347
METRIC RANK
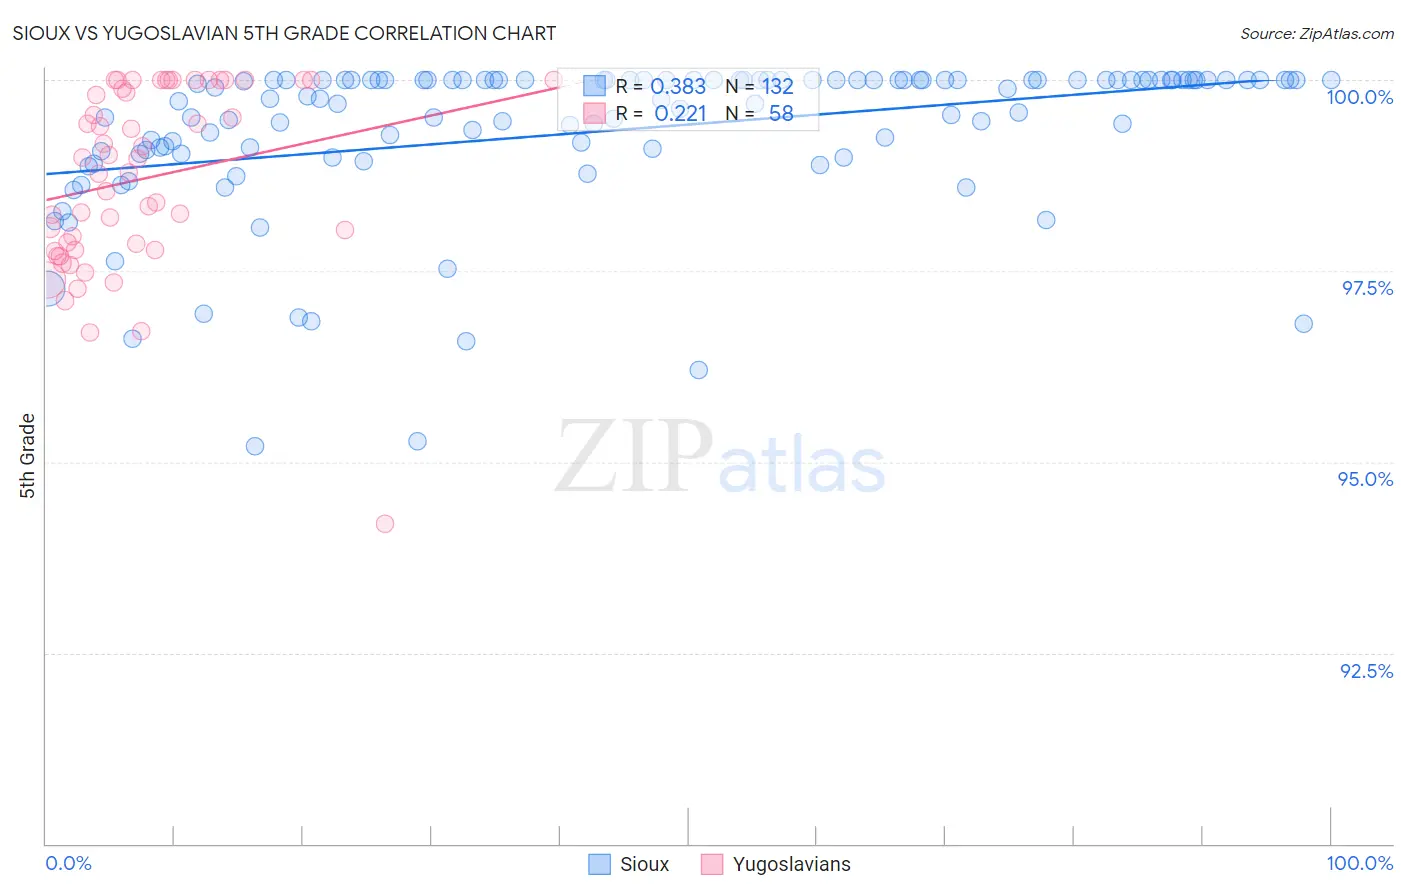
Sioux vs Yugoslavian 5th Grade Correlation Chart
The statistical analysis conducted on geographies consisting of 234,197,998 people shows a mild positive correlation between the proportion of Sioux and percentage of population with at least 5th grade education in the United States with a correlation coefficient (R) of 0.383 and weighted average of 98.2%. Similarly, the statistical analysis conducted on geographies consisting of 285,618,157 people shows a weak positive correlation between the proportion of Yugoslavians and percentage of population with at least 5th grade education in the United States with a correlation coefficient (R) of 0.221 and weighted average of 97.7%, a difference of 0.48%.
5th Grade Correlation Summary
| Measurement | Sioux | Yugoslavian |
| Minimum | 95.2% | 94.2% |
| Maximum | 100.0% | 100.0% |
| Range | 4.8% | 5.8% |
| Mean | 99.3% | 98.7% |
| Median | 99.8% | 98.9% |
| Interquartile 25% (IQ1) | 99.1% | 97.8% |
| Interquartile 75% (IQ3) | 100.0% | 100.0% |
| Interquartile Range (IQR) | 0.94% | 2.2% |
| Standard Deviation (Sample) | 1.0% | 1.2% |
| Standard Deviation (Population) | 1.0% | 1.2% |
Similar Demographics by 5th Grade
Demographics Similar to Sioux by 5th Grade
In terms of 5th grade, the demographic groups most similar to Sioux are Croatian (98.2%, a difference of 0.0%), Scotch-Irish (98.2%, a difference of 0.0%), Danish (98.2%, a difference of 0.010%), Yup'ik (98.2%, a difference of 0.010%), and Alaska Native (98.2%, a difference of 0.010%).
| Demographics | Rating | Rank | 5th Grade |
| Poles | 100.0 /100 | #16 | Exceptional 98.3% |
| Irish | 100.0 /100 | #17 | Exceptional 98.3% |
| Pennsylvania Germans | 100.0 /100 | #18 | Exceptional 98.3% |
| Finns | 100.0 /100 | #19 | Exceptional 98.2% |
| Lithuanians | 100.0 /100 | #20 | Exceptional 98.2% |
| Danes | 100.0 /100 | #21 | Exceptional 98.2% |
| Croatians | 100.0 /100 | #22 | Exceptional 98.2% |
| Sioux | 100.0 /100 | #23 | Exceptional 98.2% |
| Scotch-Irish | 100.0 /100 | #24 | Exceptional 98.2% |
| Yup'ik | 100.0 /100 | #25 | Exceptional 98.2% |
| Alaska Natives | 100.0 /100 | #26 | Exceptional 98.2% |
| French | 100.0 /100 | #27 | Exceptional 98.2% |
| Czechs | 100.0 /100 | #28 | Exceptional 98.2% |
| Scandinavians | 100.0 /100 | #29 | Exceptional 98.2% |
| French Canadians | 100.0 /100 | #30 | Exceptional 98.2% |
Demographics Similar to Yugoslavians by 5th Grade
In terms of 5th grade, the demographic groups most similar to Yugoslavians are Turkish (97.7%, a difference of 0.0%), Puget Sound Salish (97.7%, a difference of 0.0%), South African (97.7%, a difference of 0.0%), Immigrants from Germany (97.8%, a difference of 0.010%), and Cree (97.7%, a difference of 0.010%).
| Demographics | Rating | Rank | 5th Grade |
| Immigrants | Western Europe | 98.8 /100 | #91 | Exceptional 97.8% |
| Immigrants | Sweden | 98.7 /100 | #92 | Exceptional 97.8% |
| Delaware | 98.6 /100 | #93 | Exceptional 97.8% |
| Immigrants | Denmark | 98.6 /100 | #94 | Exceptional 97.8% |
| Romanians | 98.6 /100 | #95 | Exceptional 97.8% |
| Immigrants | Germany | 98.5 /100 | #96 | Exceptional 97.8% |
| Cree | 98.4 /100 | #97 | Exceptional 97.7% |
| Yugoslavians | 98.3 /100 | #98 | Exceptional 97.7% |
| Turks | 98.3 /100 | #99 | Exceptional 97.7% |
| Puget Sound Salish | 98.3 /100 | #100 | Exceptional 97.7% |
| South Africans | 98.3 /100 | #101 | Exceptional 97.7% |
| Choctaw | 98.0 /100 | #102 | Exceptional 97.7% |
| Cheyenne | 97.9 /100 | #103 | Exceptional 97.7% |
| German Russians | 97.8 /100 | #104 | Exceptional 97.7% |
| Bhutanese | 97.6 /100 | #105 | Exceptional 97.7% |