Lebanese vs Salvadoran High School Diploma
COMPARE
Lebanese
Salvadoran
High School Diploma
High School Diploma Comparison
Lebanese
Salvadorans
90.4%
HIGH SCHOOL DIPLOMA
97.4/ 100
METRIC RATING
105th/ 347
METRIC RANK
81.7%
HIGH SCHOOL DIPLOMA
0.0/ 100
METRIC RATING
338th/ 347
METRIC RANK
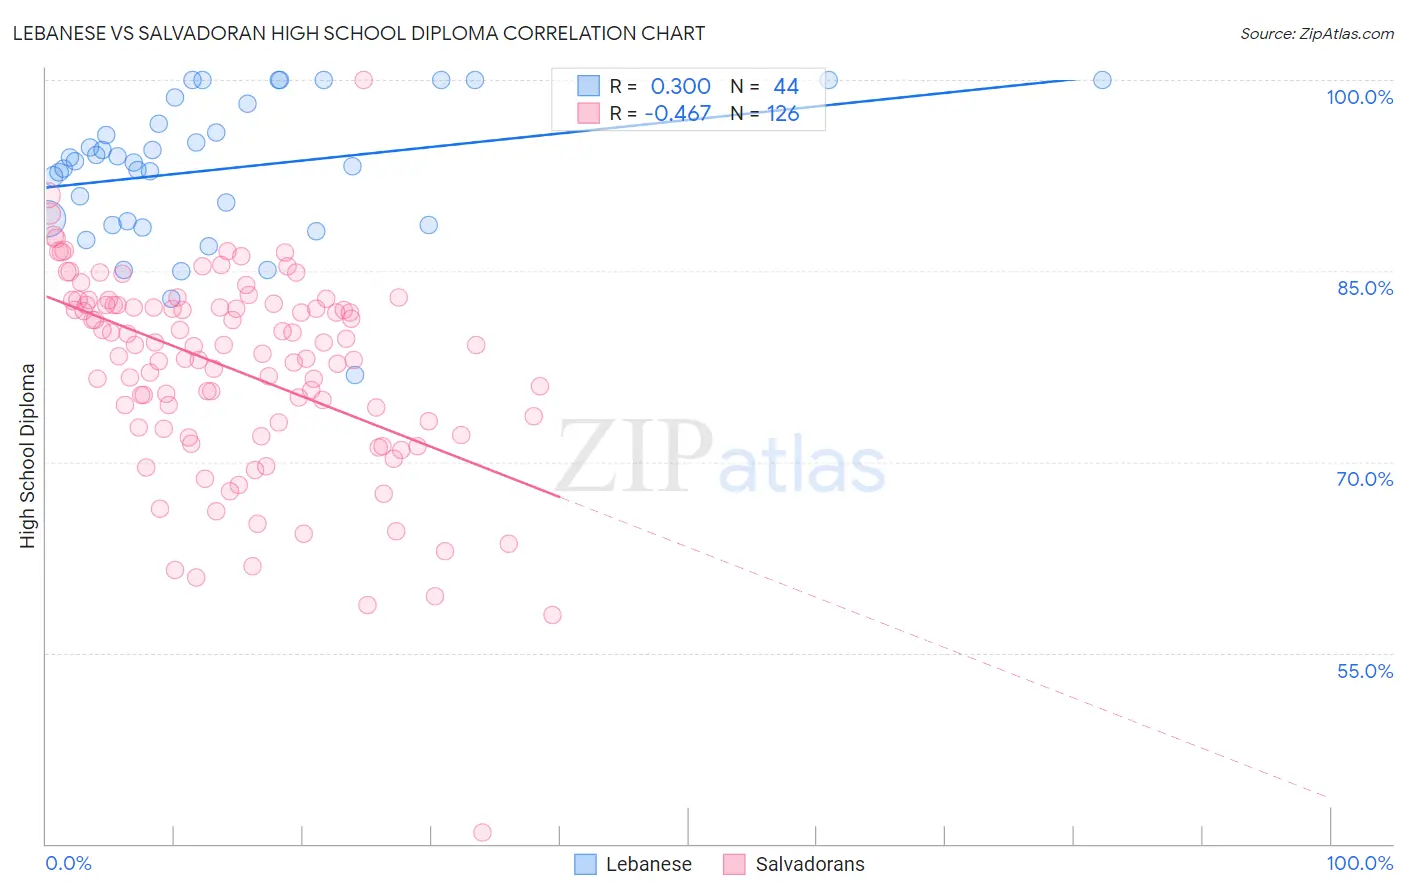
Lebanese vs Salvadoran High School Diploma Correlation Chart
The statistical analysis conducted on geographies consisting of 401,624,157 people shows a mild positive correlation between the proportion of Lebanese and percentage of population with at least high school diploma education in the United States with a correlation coefficient (R) of 0.300 and weighted average of 90.4%. Similarly, the statistical analysis conducted on geographies consisting of 399,034,198 people shows a moderate negative correlation between the proportion of Salvadorans and percentage of population with at least high school diploma education in the United States with a correlation coefficient (R) of -0.467 and weighted average of 81.7%, a difference of 10.6%.
High School Diploma Correlation Summary
| Measurement | Lebanese | Salvadoran |
| Minimum | 76.8% | 40.9% |
| Maximum | 100.0% | 100.0% |
| Range | 23.2% | 59.1% |
| Mean | 93.0% | 77.2% |
| Median | 93.6% | 79.1% |
| Interquartile 25% (IQ1) | 88.7% | 72.7% |
| Interquartile 75% (IQ3) | 97.4% | 82.3% |
| Interquartile Range (IQR) | 8.6% | 9.6% |
| Standard Deviation (Sample) | 5.5% | 8.1% |
| Standard Deviation (Population) | 5.4% | 8.1% |
Similar Demographics by High School Diploma
Demographics Similar to Lebanese by High School Diploma
In terms of high school diploma, the demographic groups most similar to Lebanese are Syrian (90.3%, a difference of 0.050%), Immigrants from Croatia (90.4%, a difference of 0.060%), Immigrants from Romania (90.4%, a difference of 0.070%), Immigrants from Russia (90.3%, a difference of 0.070%), and Palestinian (90.3%, a difference of 0.080%).
| Demographics | Rating | Rank | High School Diploma |
| Immigrants | Korea | 98.3 /100 | #98 | Exceptional 90.5% |
| Immigrants | Europe | 98.2 /100 | #99 | Exceptional 90.5% |
| Immigrants | North Macedonia | 98.1 /100 | #100 | Exceptional 90.5% |
| Immigrants | Norway | 98.0 /100 | #101 | Exceptional 90.5% |
| Aleuts | 98.0 /100 | #102 | Exceptional 90.4% |
| Immigrants | Romania | 97.8 /100 | #103 | Exceptional 90.4% |
| Immigrants | Croatia | 97.8 /100 | #104 | Exceptional 90.4% |
| Lebanese | 97.4 /100 | #105 | Exceptional 90.4% |
| Syrians | 97.0 /100 | #106 | Exceptional 90.3% |
| Immigrants | Russia | 96.9 /100 | #107 | Exceptional 90.3% |
| Palestinians | 96.7 /100 | #108 | Exceptional 90.3% |
| Immigrants | Zimbabwe | 96.7 /100 | #109 | Exceptional 90.3% |
| Immigrants | Greece | 96.6 /100 | #110 | Exceptional 90.3% |
| Menominee | 96.6 /100 | #111 | Exceptional 90.3% |
| Immigrants | Belarus | 96.4 /100 | #112 | Exceptional 90.2% |
Demographics Similar to Salvadorans by High School Diploma
In terms of high school diploma, the demographic groups most similar to Salvadorans are Pima (81.6%, a difference of 0.10%), Immigrants from Yemen (81.8%, a difference of 0.17%), Houma (81.5%, a difference of 0.20%), Immigrants from Dominican Republic (82.0%, a difference of 0.32%), and Guatemalan (82.0%, a difference of 0.33%).
| Demographics | Rating | Rank | High School Diploma |
| Central Americans | 0.0 /100 | #331 | Tragic 82.5% |
| Immigrants | Honduras | 0.0 /100 | #332 | Tragic 82.5% |
| Immigrants | Latin America | 0.0 /100 | #333 | Tragic 82.1% |
| Tohono O'odham | 0.0 /100 | #334 | Tragic 82.1% |
| Guatemalans | 0.0 /100 | #335 | Tragic 82.0% |
| Immigrants | Dominican Republic | 0.0 /100 | #336 | Tragic 82.0% |
| Immigrants | Yemen | 0.0 /100 | #337 | Tragic 81.8% |
| Salvadorans | 0.0 /100 | #338 | Tragic 81.7% |
| Pima | 0.0 /100 | #339 | Tragic 81.6% |
| Houma | 0.0 /100 | #340 | Tragic 81.5% |
| Mexicans | 0.0 /100 | #341 | Tragic 81.4% |
| Immigrants | Guatemala | 0.0 /100 | #342 | Tragic 81.4% |
| Immigrants | El Salvador | 0.0 /100 | #343 | Tragic 80.8% |
| Immigrants | Central America | 0.0 /100 | #344 | Tragic 80.1% |
| Yakama | 0.0 /100 | #345 | Tragic 80.0% |