Lebanese vs Basque High School Diploma
COMPARE
Lebanese
Basque
High School Diploma
High School Diploma Comparison
Lebanese
Basques
90.4%
HIGH SCHOOL DIPLOMA
97.4/ 100
METRIC RATING
105th/ 347
METRIC RANK
89.8%
HIGH SCHOOL DIPLOMA
88.5/ 100
METRIC RATING
129th/ 347
METRIC RANK
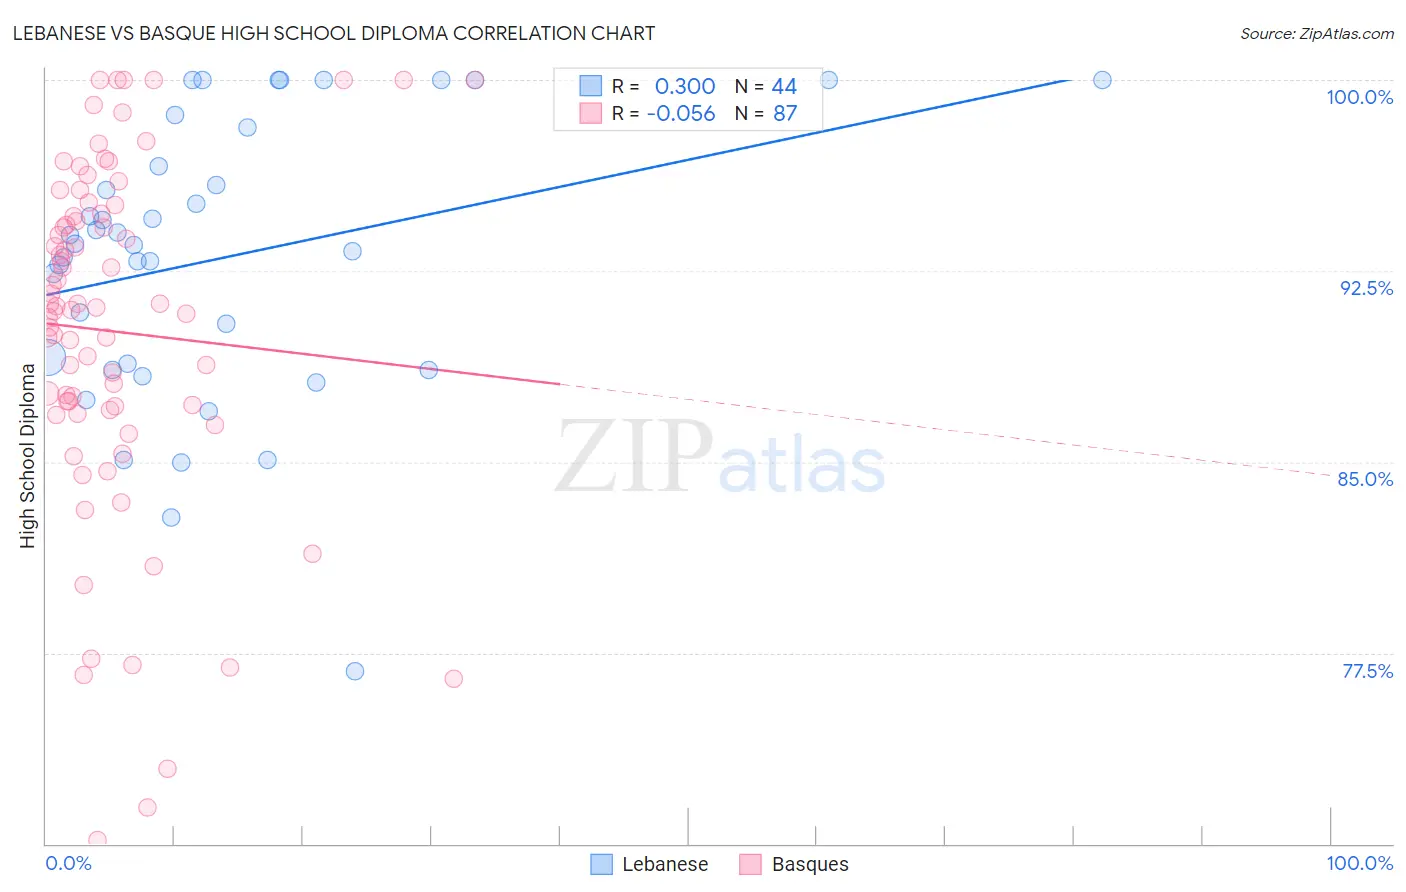
Lebanese vs Basque High School Diploma Correlation Chart
The statistical analysis conducted on geographies consisting of 401,624,157 people shows a mild positive correlation between the proportion of Lebanese and percentage of population with at least high school diploma education in the United States with a correlation coefficient (R) of 0.300 and weighted average of 90.4%. Similarly, the statistical analysis conducted on geographies consisting of 165,778,674 people shows a slight negative correlation between the proportion of Basques and percentage of population with at least high school diploma education in the United States with a correlation coefficient (R) of -0.056 and weighted average of 89.8%, a difference of 0.59%.
High School Diploma Correlation Summary
| Measurement | Lebanese | Basque |
| Minimum | 76.8% | 70.1% |
| Maximum | 100.0% | 100.0% |
| Range | 23.2% | 29.9% |
| Mean | 93.0% | 90.1% |
| Median | 93.6% | 91.1% |
| Interquartile 25% (IQ1) | 88.7% | 87.0% |
| Interquartile 75% (IQ3) | 97.4% | 94.7% |
| Interquartile Range (IQR) | 8.6% | 7.7% |
| Standard Deviation (Sample) | 5.5% | 6.8% |
| Standard Deviation (Population) | 5.4% | 6.8% |
Similar Demographics by High School Diploma
Demographics Similar to Lebanese by High School Diploma
In terms of high school diploma, the demographic groups most similar to Lebanese are Syrian (90.3%, a difference of 0.050%), Immigrants from Croatia (90.4%, a difference of 0.060%), Immigrants from Romania (90.4%, a difference of 0.070%), Immigrants from Russia (90.3%, a difference of 0.070%), and Palestinian (90.3%, a difference of 0.080%).
| Demographics | Rating | Rank | High School Diploma |
| Immigrants | Korea | 98.3 /100 | #98 | Exceptional 90.5% |
| Immigrants | Europe | 98.2 /100 | #99 | Exceptional 90.5% |
| Immigrants | North Macedonia | 98.1 /100 | #100 | Exceptional 90.5% |
| Immigrants | Norway | 98.0 /100 | #101 | Exceptional 90.5% |
| Aleuts | 98.0 /100 | #102 | Exceptional 90.4% |
| Immigrants | Romania | 97.8 /100 | #103 | Exceptional 90.4% |
| Immigrants | Croatia | 97.8 /100 | #104 | Exceptional 90.4% |
| Lebanese | 97.4 /100 | #105 | Exceptional 90.4% |
| Syrians | 97.0 /100 | #106 | Exceptional 90.3% |
| Immigrants | Russia | 96.9 /100 | #107 | Exceptional 90.3% |
| Palestinians | 96.7 /100 | #108 | Exceptional 90.3% |
| Immigrants | Zimbabwe | 96.7 /100 | #109 | Exceptional 90.3% |
| Immigrants | Greece | 96.6 /100 | #110 | Exceptional 90.3% |
| Menominee | 96.6 /100 | #111 | Exceptional 90.3% |
| Immigrants | Belarus | 96.4 /100 | #112 | Exceptional 90.2% |
Demographics Similar to Basques by High School Diploma
In terms of high school diploma, the demographic groups most similar to Basques are Puget Sound Salish (89.9%, a difference of 0.020%), Immigrants from Ukraine (89.8%, a difference of 0.020%), Immigrants from Eastern Asia (89.9%, a difference of 0.030%), Immigrants from Italy (89.8%, a difference of 0.040%), and Immigrants from Bosnia and Herzegovina (89.8%, a difference of 0.040%).
| Demographics | Rating | Rank | High School Diploma |
| Immigrants | Kazakhstan | 93.4 /100 | #122 | Exceptional 90.0% |
| German Russians | 92.0 /100 | #123 | Exceptional 90.0% |
| Mongolians | 91.6 /100 | #124 | Exceptional 89.9% |
| Egyptians | 91.1 /100 | #125 | Exceptional 89.9% |
| Alaska Natives | 91.0 /100 | #126 | Exceptional 89.9% |
| Immigrants | Eastern Asia | 89.2 /100 | #127 | Excellent 89.9% |
| Puget Sound Salish | 89.1 /100 | #128 | Excellent 89.9% |
| Basques | 88.5 /100 | #129 | Excellent 89.8% |
| Immigrants | Ukraine | 87.9 /100 | #130 | Excellent 89.8% |
| Immigrants | Italy | 87.4 /100 | #131 | Excellent 89.8% |
| Immigrants | Bosnia and Herzegovina | 87.3 /100 | #132 | Excellent 89.8% |
| Albanians | 87.2 /100 | #133 | Excellent 89.8% |
| Immigrants | Jordan | 87.2 /100 | #134 | Excellent 89.8% |
| Chippewa | 85.6 /100 | #135 | Excellent 89.7% |
| Ugandans | 83.7 /100 | #136 | Excellent 89.7% |