Latvian vs Immigrants from Middle Africa Unemployment Among Seniors over 75 years
COMPARE
Latvian
Immigrants from Middle Africa
Unemployment Among Seniors over 75 years
Unemployment Among Seniors over 75 years Comparison
Latvians
Immigrants from Middle Africa
8.6%
UNEMPLOYMENT AMONG SENIORS OVER 75 YEARS
80.5/ 100
METRIC RATING
152nd/ 347
METRIC RANK
8.3%
UNEMPLOYMENT AMONG SENIORS OVER 75 YEARS
97.9/ 100
METRIC RATING
118th/ 347
METRIC RANK
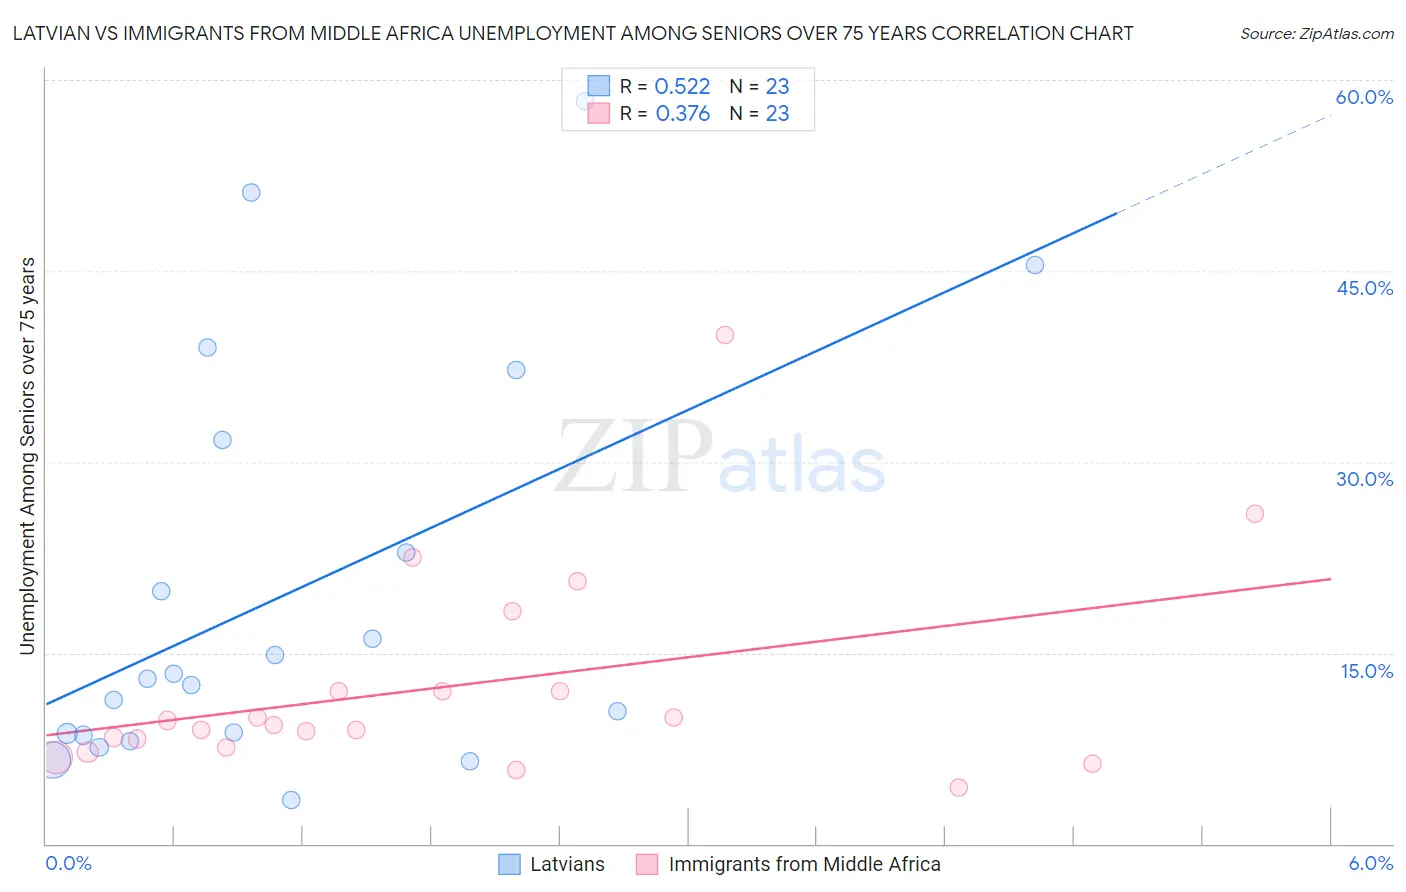
Latvian vs Immigrants from Middle Africa Unemployment Among Seniors over 75 years Correlation Chart
The statistical analysis conducted on geographies consisting of 138,130,027 people shows a substantial positive correlation between the proportion of Latvians and unemployment rate among seniors over the age of 75 in the United States with a correlation coefficient (R) of 0.522 and weighted average of 8.6%. Similarly, the statistical analysis conducted on geographies consisting of 126,464,851 people shows a mild positive correlation between the proportion of Immigrants from Middle Africa and unemployment rate among seniors over the age of 75 in the United States with a correlation coefficient (R) of 0.376 and weighted average of 8.3%, a difference of 3.4%.
Unemployment Among Seniors over 75 years Correlation Summary
| Measurement | Latvian | Immigrants from Middle Africa |
| Minimum | 3.4% | 4.4% |
| Maximum | 58.3% | 40.0% |
| Range | 54.9% | 35.6% |
| Mean | 19.8% | 12.3% |
| Median | 13.0% | 9.3% |
| Interquartile 25% (IQ1) | 8.5% | 7.5% |
| Interquartile 75% (IQ3) | 31.7% | 12.0% |
| Interquartile Range (IQR) | 23.2% | 4.5% |
| Standard Deviation (Sample) | 15.9% | 8.2% |
| Standard Deviation (Population) | 15.6% | 8.0% |
Similar Demographics by Unemployment Among Seniors over 75 years
Demographics Similar to Latvians by Unemployment Among Seniors over 75 years
In terms of unemployment among seniors over 75 years, the demographic groups most similar to Latvians are Immigrants from Bosnia and Herzegovina (8.6%, a difference of 0.010%), Mongolian (8.6%, a difference of 0.040%), Immigrants from Pakistan (8.6%, a difference of 0.070%), Ecuadorian (8.6%, a difference of 0.17%), and Paiute (8.6%, a difference of 0.18%).
| Demographics | Rating | Rank | Unemployment Among Seniors over 75 years |
| Immigrants | Romania | 86.2 /100 | #145 | Excellent 8.5% |
| Immigrants | South Eastern Asia | 85.8 /100 | #146 | Excellent 8.5% |
| Immigrants | Sierra Leone | 85.6 /100 | #147 | Excellent 8.5% |
| Immigrants | Colombia | 85.6 /100 | #148 | Excellent 8.5% |
| Immigrants | Ecuador | 84.6 /100 | #149 | Excellent 8.5% |
| Paiute | 82.5 /100 | #150 | Excellent 8.6% |
| Immigrants | Bosnia and Herzegovina | 80.6 /100 | #151 | Excellent 8.6% |
| Latvians | 80.5 /100 | #152 | Excellent 8.6% |
| Mongolians | 80.1 /100 | #153 | Excellent 8.6% |
| Immigrants | Pakistan | 79.7 /100 | #154 | Good 8.6% |
| Ecuadorians | 78.5 /100 | #155 | Good 8.6% |
| Immigrants | Bahamas | 76.5 /100 | #156 | Good 8.6% |
| Turks | 76.4 /100 | #157 | Good 8.6% |
| Ethiopians | 75.3 /100 | #158 | Good 8.6% |
| Shoshone | 74.6 /100 | #159 | Good 8.6% |
Demographics Similar to Immigrants from Middle Africa by Unemployment Among Seniors over 75 years
In terms of unemployment among seniors over 75 years, the demographic groups most similar to Immigrants from Middle Africa are Immigrants from Greece (8.3%, a difference of 0.040%), Immigrants from West Indies (8.3%, a difference of 0.18%), Sudanese (8.3%, a difference of 0.25%), Japanese (8.3%, a difference of 0.27%), and Immigrants from Asia (8.3%, a difference of 0.29%).
| Demographics | Rating | Rank | Unemployment Among Seniors over 75 years |
| French American Indians | 98.7 /100 | #111 | Exceptional 8.2% |
| Immigrants | India | 98.6 /100 | #112 | Exceptional 8.2% |
| Asians | 98.5 /100 | #113 | Exceptional 8.3% |
| Trinidadians and Tobagonians | 98.4 /100 | #114 | Exceptional 8.3% |
| Sudanese | 98.2 /100 | #115 | Exceptional 8.3% |
| Immigrants | West Indies | 98.1 /100 | #116 | Exceptional 8.3% |
| Immigrants | Greece | 97.9 /100 | #117 | Exceptional 8.3% |
| Immigrants | Middle Africa | 97.9 /100 | #118 | Exceptional 8.3% |
| Japanese | 97.5 /100 | #119 | Exceptional 8.3% |
| Immigrants | Asia | 97.4 /100 | #120 | Exceptional 8.3% |
| Immigrants | Croatia | 97.2 /100 | #121 | Exceptional 8.3% |
| Immigrants | Russia | 97.1 /100 | #122 | Exceptional 8.3% |
| Immigrants | Nepal | 96.9 /100 | #123 | Exceptional 8.3% |
| Thais | 96.8 /100 | #124 | Exceptional 8.3% |
| Immigrants | Moldova | 96.7 /100 | #125 | Exceptional 8.3% |