Korean vs Irish Single Father Households
COMPARE
Korean
Irish
Single Father Households
Single Father Households Comparison
Koreans
Irish
2.4%
SINGLE FATHER HOUSEHOLDS
24.1/ 100
METRIC RATING
206th/ 347
METRIC RANK
2.3%
SINGLE FATHER HOUSEHOLDS
72.1/ 100
METRIC RATING
163rd/ 347
METRIC RANK
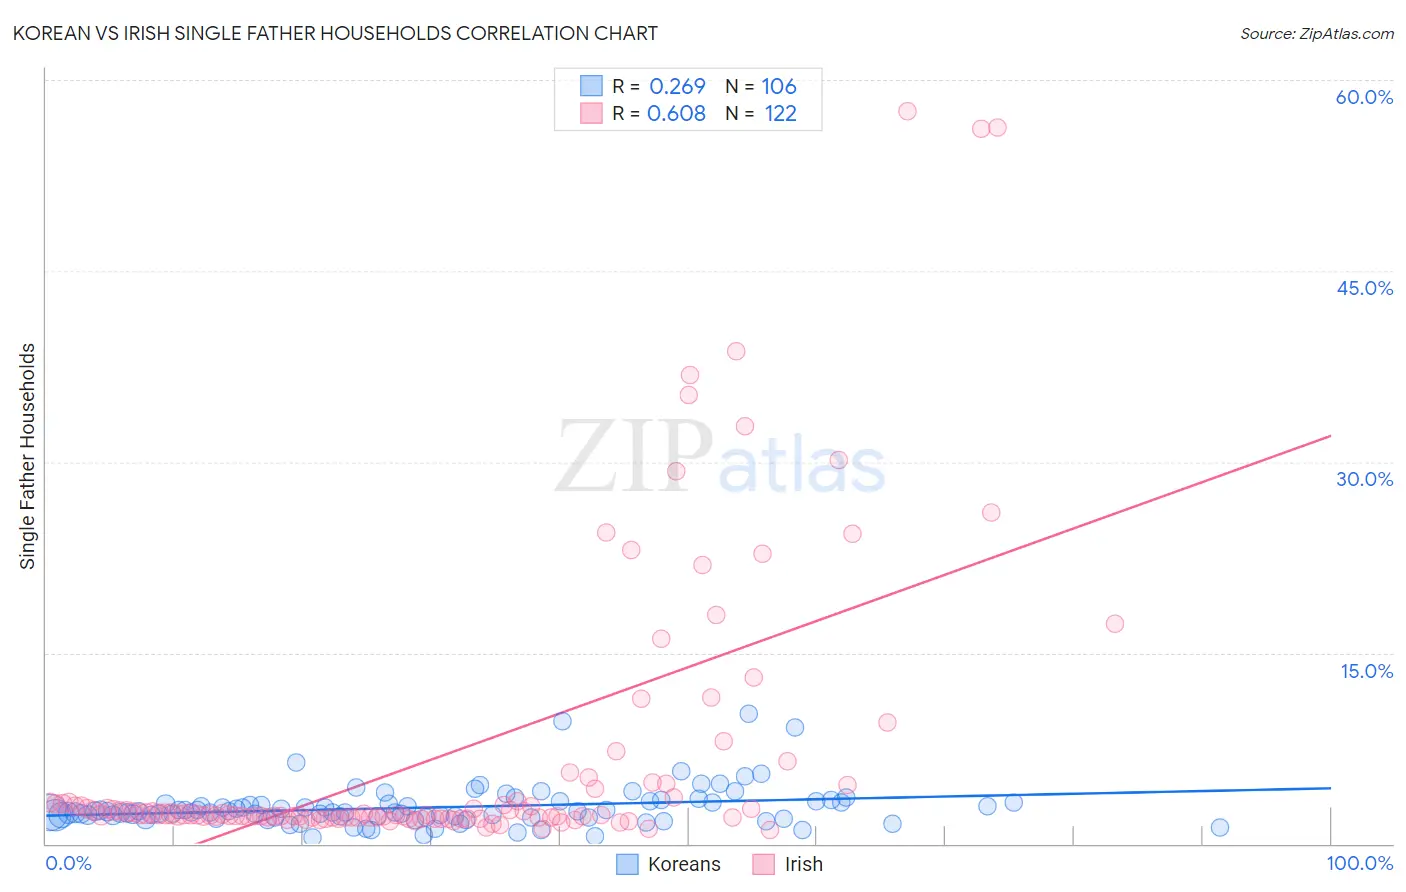
Korean vs Irish Single Father Households Correlation Chart
The statistical analysis conducted on geographies consisting of 503,655,227 people shows a weak positive correlation between the proportion of Koreans and percentage of single father households in the United States with a correlation coefficient (R) of 0.269 and weighted average of 2.4%. Similarly, the statistical analysis conducted on geographies consisting of 562,350,400 people shows a significant positive correlation between the proportion of Irish and percentage of single father households in the United States with a correlation coefficient (R) of 0.608 and weighted average of 2.3%, a difference of 3.9%.
Single Father Households Correlation Summary
| Measurement | Korean | Irish |
| Minimum | 0.54% | 1.1% |
| Maximum | 10.2% | 57.5% |
| Range | 9.7% | 56.4% |
| Mean | 2.8% | 7.1% |
| Median | 2.5% | 2.3% |
| Interquartile 25% (IQ1) | 2.1% | 2.1% |
| Interquartile 75% (IQ3) | 3.2% | 4.3% |
| Interquartile Range (IQR) | 1.1% | 2.3% |
| Standard Deviation (Sample) | 1.6% | 11.5% |
| Standard Deviation (Population) | 1.6% | 11.4% |
Similar Demographics by Single Father Households
Demographics Similar to Koreans by Single Father Households
In terms of single father households, the demographic groups most similar to Koreans are Immigrants from Afghanistan (2.4%, a difference of 0.0%), Ecuadorian (2.4%, a difference of 0.030%), French Canadian (2.4%, a difference of 0.060%), German Russian (2.4%, a difference of 0.15%), and White/Caucasian (2.4%, a difference of 0.15%).
| Demographics | Rating | Rank | Single Father Households |
| Immigrants | Vietnam | 27.1 /100 | #199 | Fair 2.4% |
| Peruvians | 27.1 /100 | #200 | Fair 2.4% |
| Immigrants | Uganda | 26.0 /100 | #201 | Fair 2.4% |
| German Russians | 25.7 /100 | #202 | Fair 2.4% |
| French Canadians | 24.7 /100 | #203 | Fair 2.4% |
| Ecuadorians | 24.5 /100 | #204 | Fair 2.4% |
| Immigrants | Afghanistan | 24.2 /100 | #205 | Fair 2.4% |
| Koreans | 24.1 /100 | #206 | Fair 2.4% |
| Whites/Caucasians | 22.6 /100 | #207 | Fair 2.4% |
| Immigrants | Kenya | 20.3 /100 | #208 | Fair 2.4% |
| Immigrants | Peru | 19.3 /100 | #209 | Poor 2.4% |
| Immigrants | Costa Rica | 19.2 /100 | #210 | Poor 2.4% |
| Immigrants | Nigeria | 18.7 /100 | #211 | Poor 2.4% |
| Finns | 18.3 /100 | #212 | Poor 2.4% |
| Norwegians | 17.1 /100 | #213 | Poor 2.4% |
Demographics Similar to Irish by Single Father Households
In terms of single father households, the demographic groups most similar to Irish are Scottish (2.3%, a difference of 0.070%), Swiss (2.3%, a difference of 0.11%), Pakistani (2.3%, a difference of 0.14%), Scotch-Irish (2.3%, a difference of 0.24%), and English (2.3%, a difference of 0.31%).
| Demographics | Rating | Rank | Single Father Households |
| Immigrants | South America | 79.9 /100 | #156 | Good 2.3% |
| Canadians | 79.7 /100 | #157 | Good 2.3% |
| Immigrants | Senegal | 79.4 /100 | #158 | Good 2.3% |
| Immigrants | West Indies | 77.9 /100 | #159 | Good 2.3% |
| Immigrants | Bolivia | 76.3 /100 | #160 | Good 2.3% |
| Swiss | 73.2 /100 | #161 | Good 2.3% |
| Scottish | 72.8 /100 | #162 | Good 2.3% |
| Irish | 72.1 /100 | #163 | Good 2.3% |
| Pakistanis | 70.6 /100 | #164 | Good 2.3% |
| Scotch-Irish | 69.4 /100 | #165 | Good 2.3% |
| English | 68.6 /100 | #166 | Good 2.3% |
| South Americans | 64.3 /100 | #167 | Good 2.3% |
| Icelanders | 63.1 /100 | #168 | Good 2.3% |
| Czechs | 62.5 /100 | #169 | Good 2.3% |
| Ugandans | 62.2 /100 | #170 | Good 2.3% |