Korean vs Immigrants from Switzerland Unemployment Among Ages 25 to 29 years
COMPARE
Korean
Immigrants from Switzerland
Unemployment Among Ages 25 to 29 years
Unemployment Among Ages 25 to 29 years Comparison
Koreans
Immigrants from Switzerland
6.7%
UNEMPLOYMENT AMONG AGES 25 TO 29 YEARS
29.3/ 100
METRIC RATING
190th/ 347
METRIC RANK
6.3%
UNEMPLOYMENT AMONG AGES 25 TO 29 YEARS
96.0/ 100
METRIC RATING
79th/ 347
METRIC RANK
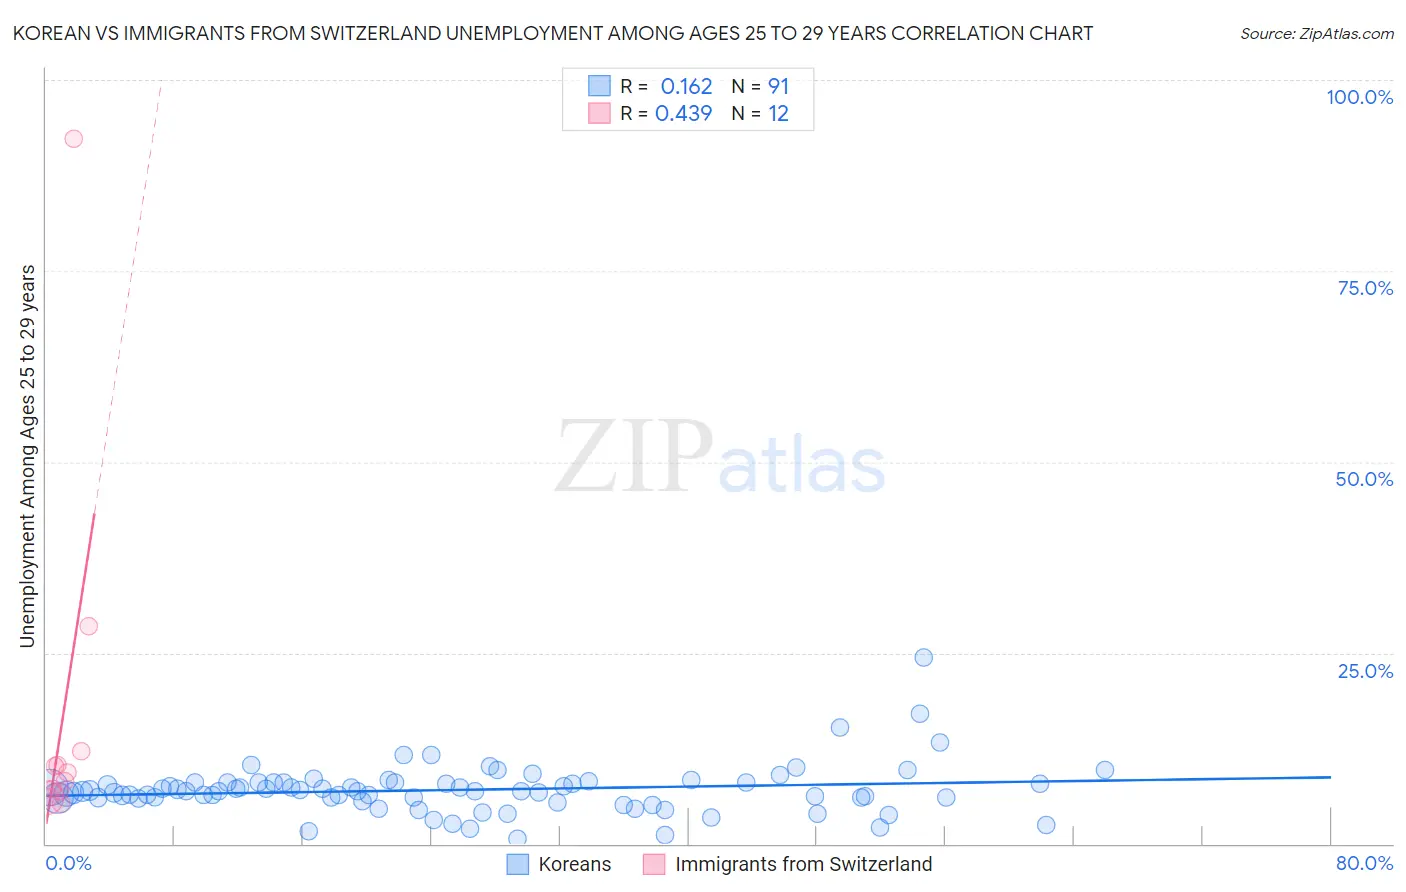
Korean vs Immigrants from Switzerland Unemployment Among Ages 25 to 29 years Correlation Chart
The statistical analysis conducted on geographies consisting of 473,026,507 people shows a poor positive correlation between the proportion of Koreans and unemployment rate among population between the ages 25 and 29 in the United States with a correlation coefficient (R) of 0.162 and weighted average of 6.7%. Similarly, the statistical analysis conducted on geographies consisting of 144,055,678 people shows a moderate positive correlation between the proportion of Immigrants from Switzerland and unemployment rate among population between the ages 25 and 29 in the United States with a correlation coefficient (R) of 0.439 and weighted average of 6.3%, a difference of 6.6%.
Unemployment Among Ages 25 to 29 years Correlation Summary
| Measurement | Korean | Immigrants from Switzerland |
| Minimum | 0.70% | 5.3% |
| Maximum | 24.4% | 92.3% |
| Range | 23.7% | 87.0% |
| Mean | 7.0% | 16.9% |
| Median | 6.9% | 8.7% |
| Interquartile 25% (IQ1) | 6.0% | 6.5% |
| Interquartile 75% (IQ3) | 8.0% | 11.2% |
| Interquartile Range (IQR) | 2.0% | 4.7% |
| Standard Deviation (Sample) | 3.2% | 24.5% |
| Standard Deviation (Population) | 3.2% | 23.5% |
Similar Demographics by Unemployment Among Ages 25 to 29 years
Demographics Similar to Koreans by Unemployment Among Ages 25 to 29 years
In terms of unemployment among ages 25 to 29 years, the demographic groups most similar to Koreans are Chickasaw (6.7%, a difference of 0.040%), Immigrants from Ukraine (6.7%, a difference of 0.050%), Alsatian (6.7%, a difference of 0.090%), Immigrants from Greece (6.7%, a difference of 0.090%), and Immigrants from Western Asia (6.7%, a difference of 0.15%).
| Demographics | Rating | Rank | Unemployment Among Ages 25 to 29 years |
| Immigrants | Scotland | 39.6 /100 | #183 | Fair 6.7% |
| Immigrants | Costa Rica | 38.3 /100 | #184 | Fair 6.7% |
| Moroccans | 35.9 /100 | #185 | Fair 6.7% |
| Immigrants | Iran | 34.4 /100 | #186 | Fair 6.7% |
| Immigrants | South America | 33.0 /100 | #187 | Fair 6.7% |
| Irish | 32.8 /100 | #188 | Fair 6.7% |
| Argentineans | 32.1 /100 | #189 | Fair 6.7% |
| Koreans | 29.3 /100 | #190 | Fair 6.7% |
| Chickasaw | 28.7 /100 | #191 | Fair 6.7% |
| Immigrants | Ukraine | 28.6 /100 | #192 | Fair 6.7% |
| Alsatians | 28.1 /100 | #193 | Fair 6.7% |
| Immigrants | Greece | 28.0 /100 | #194 | Fair 6.7% |
| Immigrants | Western Asia | 27.3 /100 | #195 | Fair 6.7% |
| Hungarians | 26.8 /100 | #196 | Fair 6.8% |
| Italians | 26.5 /100 | #197 | Fair 6.8% |
Demographics Similar to Immigrants from Switzerland by Unemployment Among Ages 25 to 29 years
In terms of unemployment among ages 25 to 29 years, the demographic groups most similar to Immigrants from Switzerland are Immigrants from Romania (6.3%, a difference of 0.060%), Iranian (6.3%, a difference of 0.10%), Immigrants from Poland (6.3%, a difference of 0.14%), Asian (6.3%, a difference of 0.17%), and Icelander (6.3%, a difference of 0.27%).
| Demographics | Rating | Rank | Unemployment Among Ages 25 to 29 years |
| Scandinavians | 97.4 /100 | #72 | Exceptional 6.3% |
| Belgians | 97.0 /100 | #73 | Exceptional 6.3% |
| Carpatho Rusyns | 96.9 /100 | #74 | Exceptional 6.3% |
| Immigrants | Jordan | 96.8 /100 | #75 | Exceptional 6.3% |
| Immigrants | Korea | 96.7 /100 | #76 | Exceptional 6.3% |
| Icelanders | 96.6 /100 | #77 | Exceptional 6.3% |
| Asians | 96.4 /100 | #78 | Exceptional 6.3% |
| Immigrants | Switzerland | 96.0 /100 | #79 | Exceptional 6.3% |
| Immigrants | Romania | 95.9 /100 | #80 | Exceptional 6.3% |
| Iranians | 95.8 /100 | #81 | Exceptional 6.3% |
| Immigrants | Poland | 95.7 /100 | #82 | Exceptional 6.3% |
| Slovenes | 95.3 /100 | #83 | Exceptional 6.3% |
| Immigrants | Spain | 95.2 /100 | #84 | Exceptional 6.3% |
| Immigrants | Sweden | 95.1 /100 | #85 | Exceptional 6.3% |
| Immigrants | Asia | 94.9 /100 | #86 | Exceptional 6.3% |