Immigrants from Brazil vs Immigrants from Laos No Schooling Completed
COMPARE
Immigrants from Brazil
Immigrants from Laos
No Schooling Completed
No Schooling Completed Comparison
Immigrants from Brazil
Immigrants from Laos
2.1%
NO SCHOOLING COMPLETED
63.8/ 100
METRIC RATING
162nd/ 347
METRIC RANK
3.1%
NO SCHOOLING COMPLETED
0.0/ 100
METRIC RATING
321st/ 347
METRIC RANK
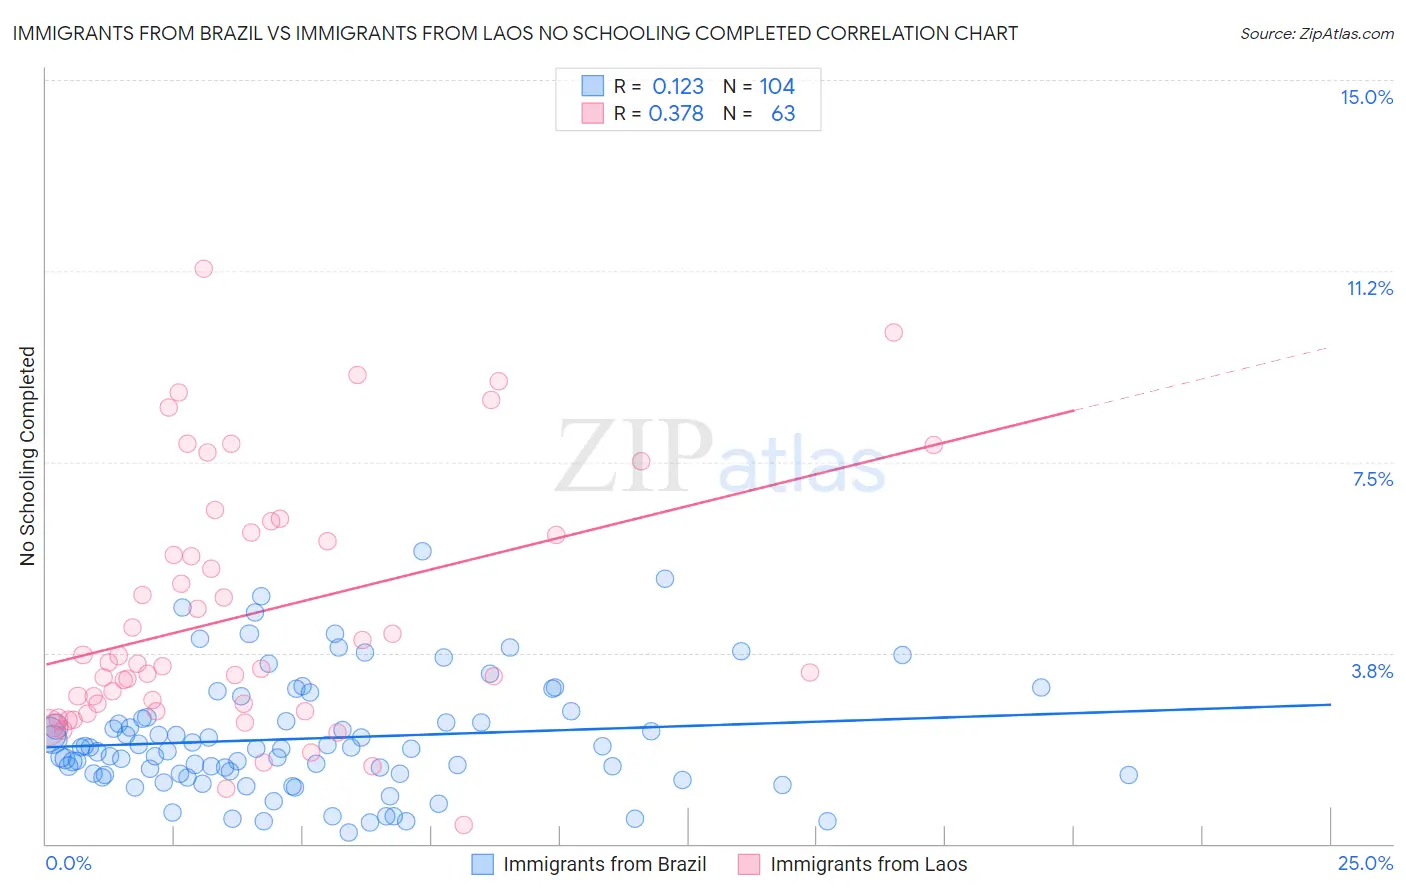
Immigrants from Brazil vs Immigrants from Laos No Schooling Completed Correlation Chart
The statistical analysis conducted on geographies consisting of 340,005,374 people shows a poor positive correlation between the proportion of Immigrants from Brazil and percentage of population with no schooling in the United States with a correlation coefficient (R) of 0.123 and weighted average of 2.1%. Similarly, the statistical analysis conducted on geographies consisting of 200,828,935 people shows a mild positive correlation between the proportion of Immigrants from Laos and percentage of population with no schooling in the United States with a correlation coefficient (R) of 0.378 and weighted average of 3.1%, a difference of 53.5%.
No Schooling Completed Correlation Summary
| Measurement | Immigrants from Brazil | Immigrants from Laos |
| Minimum | 0.21% | 0.36% |
| Maximum | 5.7% | 11.3% |
| Range | 5.5% | 10.9% |
| Mean | 2.1% | 4.5% |
| Median | 1.9% | 3.5% |
| Interquartile 25% (IQ1) | 1.4% | 2.6% |
| Interquartile 75% (IQ3) | 2.5% | 6.1% |
| Interquartile Range (IQR) | 1.1% | 3.5% |
| Standard Deviation (Sample) | 1.1% | 2.5% |
| Standard Deviation (Population) | 1.1% | 2.5% |
Similar Demographics by No Schooling Completed
Demographics Similar to Immigrants from Brazil by No Schooling Completed
In terms of no schooling completed, the demographic groups most similar to Immigrants from Brazil are Ugandan (2.0%, a difference of 0.11%), Albanian (2.1%, a difference of 0.24%), Kenyan (2.0%, a difference of 0.28%), Immigrants from Spain (2.0%, a difference of 0.39%), and Immigrants from Korea (2.0%, a difference of 0.44%).
| Demographics | Rating | Rank | No Schooling Completed |
| Immigrants | Russia | 67.6 /100 | #155 | Good 2.0% |
| Chileans | 67.2 /100 | #156 | Good 2.0% |
| Immigrants | Sri Lanka | 67.0 /100 | #157 | Good 2.0% |
| Immigrants | Korea | 66.7 /100 | #158 | Good 2.0% |
| Immigrants | Spain | 66.4 /100 | #159 | Good 2.0% |
| Kenyans | 65.7 /100 | #160 | Good 2.0% |
| Ugandans | 64.6 /100 | #161 | Good 2.0% |
| Immigrants | Brazil | 63.8 /100 | #162 | Good 2.1% |
| Albanians | 62.2 /100 | #163 | Good 2.1% |
| Comanche | 60.7 /100 | #164 | Good 2.1% |
| Brazilians | 60.2 /100 | #165 | Good 2.1% |
| Dutch West Indians | 59.9 /100 | #166 | Average 2.1% |
| Egyptians | 59.2 /100 | #167 | Average 2.1% |
| Cheyenne | 58.6 /100 | #168 | Average 2.1% |
| Apache | 56.7 /100 | #169 | Average 2.1% |
Demographics Similar to Immigrants from Laos by No Schooling Completed
In terms of no schooling completed, the demographic groups most similar to Immigrants from Laos are Immigrants from Bangladesh (3.1%, a difference of 0.11%), Immigrants from Burma/Myanmar (3.1%, a difference of 0.15%), Immigrants from Honduras (3.2%, a difference of 0.67%), Vietnamese (3.2%, a difference of 0.86%), and Immigrants from Guyana (3.1%, a difference of 0.89%).
| Demographics | Rating | Rank | No Schooling Completed |
| Immigrants | Belize | 0.0 /100 | #314 | Tragic 3.1% |
| Immigrants | Nicaragua | 0.0 /100 | #315 | Tragic 3.1% |
| Immigrants | Ecuador | 0.0 /100 | #316 | Tragic 3.1% |
| Cape Verdeans | 0.0 /100 | #317 | Tragic 3.1% |
| Immigrants | Guyana | 0.0 /100 | #318 | Tragic 3.1% |
| Immigrants | Burma/Myanmar | 0.0 /100 | #319 | Tragic 3.1% |
| Immigrants | Bangladesh | 0.0 /100 | #320 | Tragic 3.1% |
| Immigrants | Laos | 0.0 /100 | #321 | Tragic 3.1% |
| Immigrants | Honduras | 0.0 /100 | #322 | Tragic 3.2% |
| Vietnamese | 0.0 /100 | #323 | Tragic 3.2% |
| Mexican American Indians | 0.0 /100 | #324 | Tragic 3.2% |
| Dominicans | 0.0 /100 | #325 | Tragic 3.2% |
| Indonesians | 0.0 /100 | #326 | Tragic 3.2% |
| Immigrants | Latin America | 0.0 /100 | #327 | Tragic 3.3% |
| Mexicans | 0.0 /100 | #328 | Tragic 3.3% |