Kiowa vs Hungarian Unemployment Among Ages 20 to 24 years
COMPARE
Kiowa
Hungarian
Unemployment Among Ages 20 to 24 years
Unemployment Among Ages 20 to 24 years Comparison
Kiowa
Hungarians
10.5%
UNEMPLOYMENT AMONG AGES 20 TO 24 YEARS
11.7/ 100
METRIC RATING
214th/ 347
METRIC RANK
10.2%
UNEMPLOYMENT AMONG AGES 20 TO 24 YEARS
74.4/ 100
METRIC RATING
150th/ 347
METRIC RANK
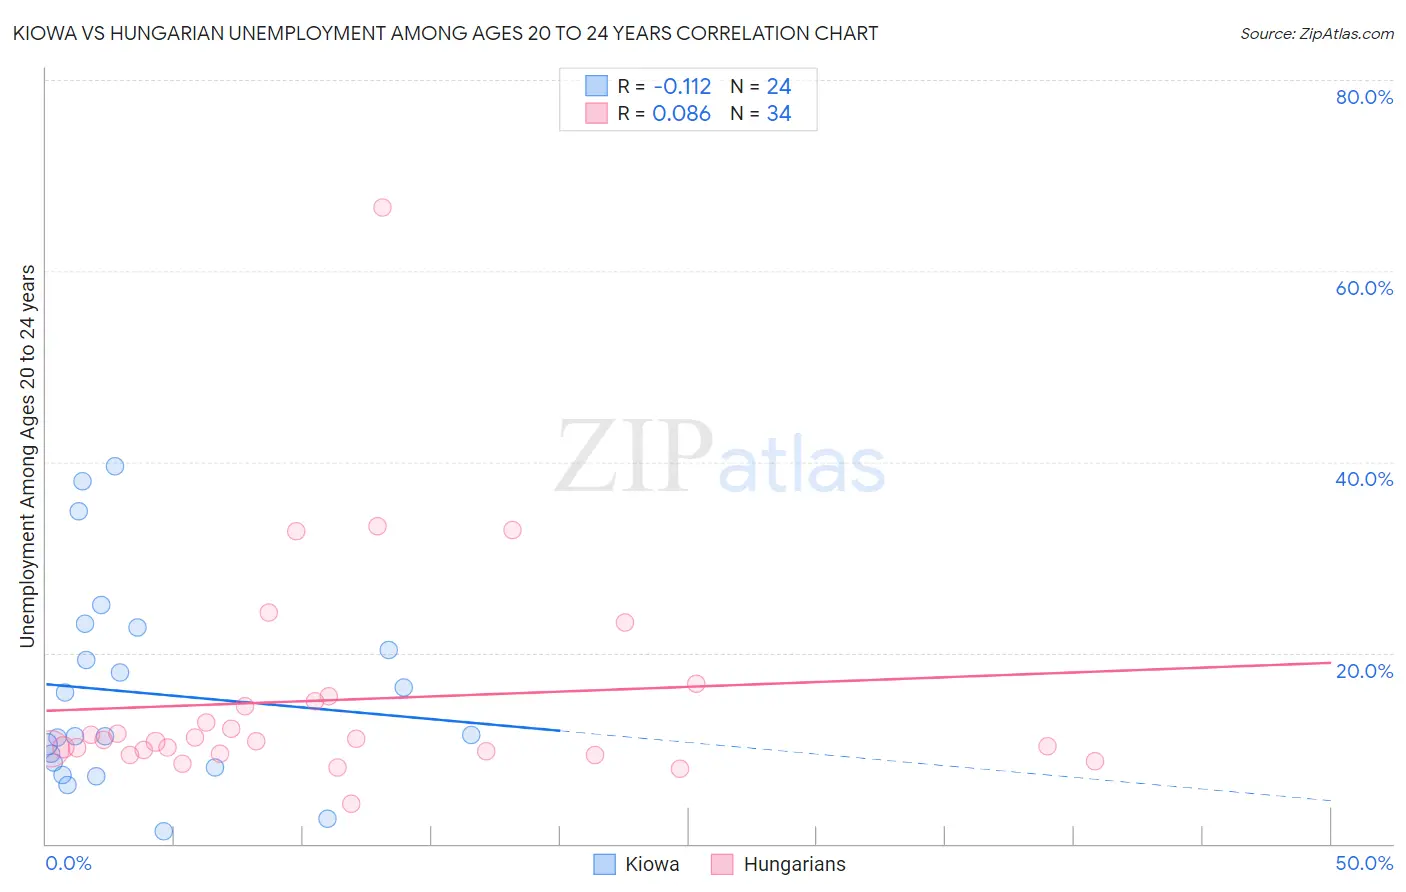
Kiowa vs Hungarian Unemployment Among Ages 20 to 24 years Correlation Chart
The statistical analysis conducted on geographies consisting of 55,577,250 people shows a poor negative correlation between the proportion of Kiowa and unemployment rate among population between the ages 20 and 24 in the United States with a correlation coefficient (R) of -0.112 and weighted average of 10.5%. Similarly, the statistical analysis conducted on geographies consisting of 459,669,965 people shows a slight positive correlation between the proportion of Hungarians and unemployment rate among population between the ages 20 and 24 in the United States with a correlation coefficient (R) of 0.086 and weighted average of 10.2%, a difference of 2.9%.
Unemployment Among Ages 20 to 24 years Correlation Summary
| Measurement | Kiowa | Hungarian |
| Minimum | 1.3% | 4.2% |
| Maximum | 39.5% | 66.7% |
| Range | 38.2% | 62.5% |
| Mean | 15.8% | 15.1% |
| Median | 11.3% | 10.8% |
| Interquartile 25% (IQ1) | 8.2% | 9.7% |
| Interquartile 75% (IQ3) | 21.5% | 14.9% |
| Interquartile Range (IQR) | 13.3% | 5.2% |
| Standard Deviation (Sample) | 10.5% | 11.7% |
| Standard Deviation (Population) | 10.3% | 11.5% |
Similar Demographics by Unemployment Among Ages 20 to 24 years
Demographics Similar to Kiowa by Unemployment Among Ages 20 to 24 years
In terms of unemployment among ages 20 to 24 years, the demographic groups most similar to Kiowa are Guatemalan (10.5%, a difference of 0.040%), Honduran (10.5%, a difference of 0.11%), Immigrants from Sri Lanka (10.5%, a difference of 0.18%), Costa Rican (10.5%, a difference of 0.20%), and Immigrants from Guatemala (10.5%, a difference of 0.23%).
| Demographics | Rating | Rank | Unemployment Among Ages 20 to 24 years |
| Immigrants | Honduras | 17.9 /100 | #207 | Poor 10.4% |
| Immigrants | Hong Kong | 17.6 /100 | #208 | Poor 10.5% |
| Peruvians | 17.2 /100 | #209 | Poor 10.5% |
| Immigrants | Belgium | 16.9 /100 | #210 | Poor 10.5% |
| Immigrants | Guatemala | 14.6 /100 | #211 | Poor 10.5% |
| Immigrants | Sri Lanka | 14.0 /100 | #212 | Poor 10.5% |
| Guatemalans | 12.2 /100 | #213 | Poor 10.5% |
| Kiowa | 11.7 /100 | #214 | Poor 10.5% |
| Hondurans | 10.5 /100 | #215 | Poor 10.5% |
| Costa Ricans | 9.6 /100 | #216 | Tragic 10.5% |
| Cherokee | 9.3 /100 | #217 | Tragic 10.5% |
| Immigrants | Nonimmigrants | 8.8 /100 | #218 | Tragic 10.5% |
| Immigrants | Southern Europe | 8.0 /100 | #219 | Tragic 10.5% |
| Eastern Europeans | 6.9 /100 | #220 | Tragic 10.6% |
| Central Americans | 6.8 /100 | #221 | Tragic 10.6% |
Demographics Similar to Hungarians by Unemployment Among Ages 20 to 24 years
In terms of unemployment among ages 20 to 24 years, the demographic groups most similar to Hungarians are Immigrants from Scotland (10.2%, a difference of 0.010%), Immigrants from South Africa (10.2%, a difference of 0.040%), Immigrants from Romania (10.2%, a difference of 0.060%), Iranian (10.2%, a difference of 0.10%), and Immigrants from Taiwan (10.2%, a difference of 0.14%).
| Demographics | Rating | Rank | Unemployment Among Ages 20 to 24 years |
| Immigrants | Jordan | 79.0 /100 | #143 | Good 10.2% |
| Brazilians | 78.4 /100 | #144 | Good 10.2% |
| Argentineans | 78.0 /100 | #145 | Good 10.2% |
| Asians | 77.7 /100 | #146 | Good 10.2% |
| French Canadians | 77.5 /100 | #147 | Good 10.2% |
| Immigrants | Romania | 75.7 /100 | #148 | Good 10.2% |
| Immigrants | Scotland | 74.6 /100 | #149 | Good 10.2% |
| Hungarians | 74.4 /100 | #150 | Good 10.2% |
| Immigrants | South Africa | 73.6 /100 | #151 | Good 10.2% |
| Iranians | 72.4 /100 | #152 | Good 10.2% |
| Immigrants | Taiwan | 71.4 /100 | #153 | Good 10.2% |
| Immigrants | Switzerland | 71.3 /100 | #154 | Good 10.2% |
| Lithuanians | 70.0 /100 | #155 | Good 10.2% |
| Canadians | 66.7 /100 | #156 | Good 10.2% |
| Immigrants | Uganda | 65.6 /100 | #157 | Good 10.2% |