Houma vs Immigrants from Eastern Europe 5th Grade
COMPARE
Houma
Immigrants from Eastern Europe
5th Grade
5th Grade Comparison
Houma
Immigrants from Eastern Europe
96.6%
5TH GRADE
0.1/ 100
METRIC RATING
281st/ 347
METRIC RANK
97.4%
5TH GRADE
75.0/ 100
METRIC RATING
151st/ 347
METRIC RANK
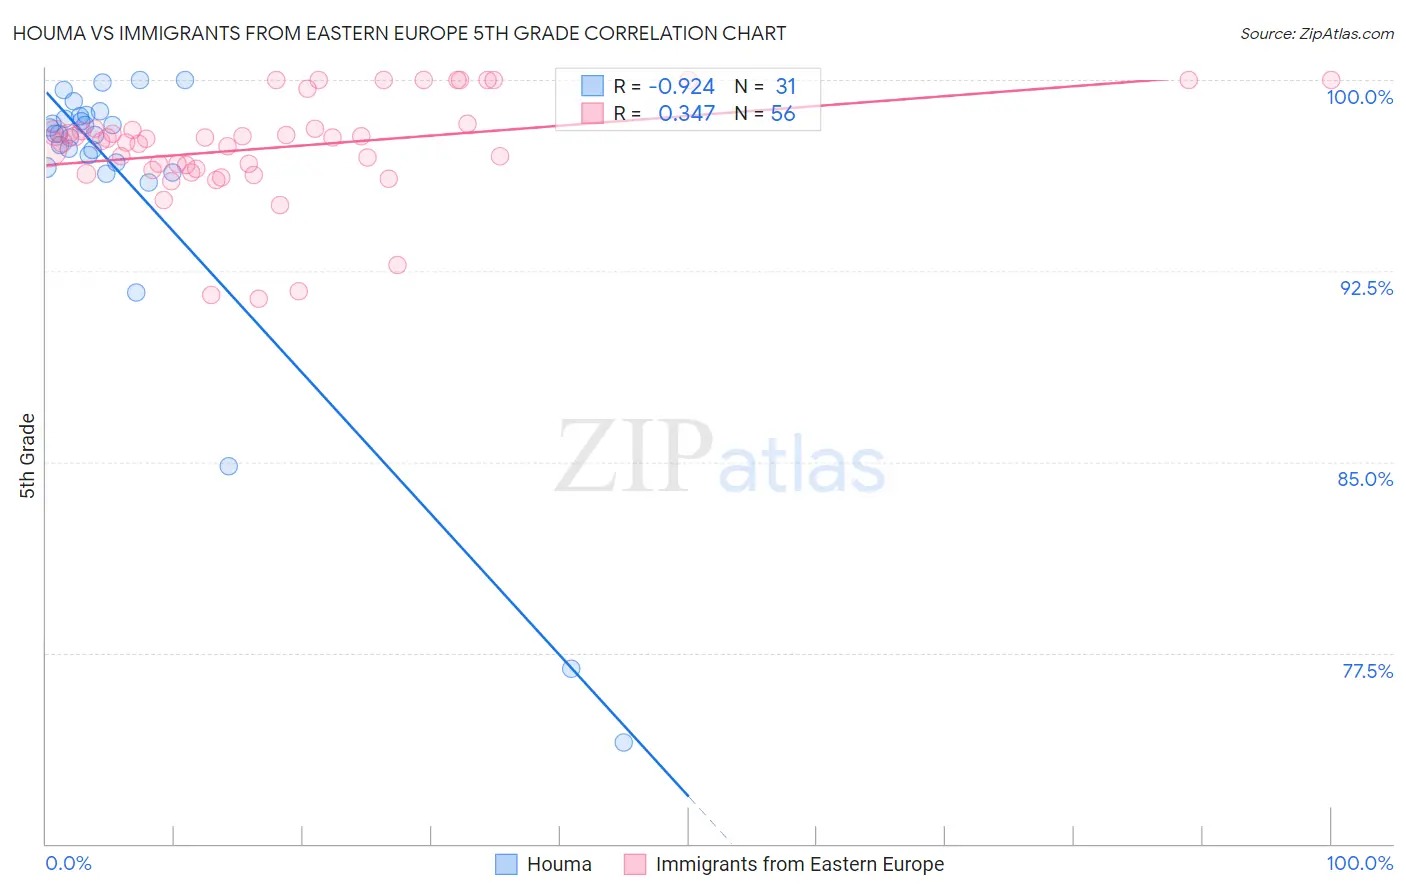
Houma vs Immigrants from Eastern Europe 5th Grade Correlation Chart
The statistical analysis conducted on geographies consisting of 36,795,916 people shows a near-perfect negative correlation between the proportion of Houma and percentage of population with at least 5th grade education in the United States with a correlation coefficient (R) of -0.924 and weighted average of 96.6%. Similarly, the statistical analysis conducted on geographies consisting of 475,879,420 people shows a mild positive correlation between the proportion of Immigrants from Eastern Europe and percentage of population with at least 5th grade education in the United States with a correlation coefficient (R) of 0.347 and weighted average of 97.4%, a difference of 0.86%.
5th Grade Correlation Summary
| Measurement | Houma | Immigrants from Eastern Europe |
| Minimum | 74.0% | 91.4% |
| Maximum | 100.0% | 100.0% |
| Range | 26.0% | 8.6% |
| Mean | 95.9% | 97.4% |
| Median | 97.9% | 97.6% |
| Interquartile 25% (IQ1) | 96.6% | 96.5% |
| Interquartile 75% (IQ3) | 98.6% | 98.1% |
| Interquartile Range (IQR) | 2.0% | 1.6% |
| Standard Deviation (Sample) | 6.2% | 2.1% |
| Standard Deviation (Population) | 6.1% | 2.0% |
Similar Demographics by 5th Grade
Demographics Similar to Houma by 5th Grade
In terms of 5th grade, the demographic groups most similar to Houma are Immigrants from Western Africa (96.6%, a difference of 0.0%), Barbadian (96.6%, a difference of 0.0%), Fijian (96.6%, a difference of 0.0%), Immigrants from Philippines (96.6%, a difference of 0.010%), and Immigrants from Trinidad and Tobago (96.6%, a difference of 0.010%).
| Demographics | Rating | Rank | 5th Grade |
| Immigrants | Cameroon | 0.1 /100 | #274 | Tragic 96.7% |
| Immigrants | Peru | 0.1 /100 | #275 | Tragic 96.6% |
| Cubans | 0.1 /100 | #276 | Tragic 96.6% |
| Immigrants | Bolivia | 0.1 /100 | #277 | Tragic 96.6% |
| Immigrants | Ghana | 0.1 /100 | #278 | Tragic 96.6% |
| Immigrants | Philippines | 0.1 /100 | #279 | Tragic 96.6% |
| Immigrants | Western Africa | 0.1 /100 | #280 | Tragic 96.6% |
| Houma | 0.1 /100 | #281 | Tragic 96.6% |
| Barbadians | 0.1 /100 | #282 | Tragic 96.6% |
| Fijians | 0.1 /100 | #283 | Tragic 96.6% |
| Immigrants | Trinidad and Tobago | 0.1 /100 | #284 | Tragic 96.6% |
| Immigrants | St. Vincent and the Grenadines | 0.1 /100 | #285 | Tragic 96.6% |
| Immigrants | Thailand | 0.1 /100 | #286 | Tragic 96.6% |
| Immigrants | Afghanistan | 0.1 /100 | #287 | Tragic 96.6% |
| Immigrants | Barbados | 0.0 /100 | #288 | Tragic 96.6% |
Demographics Similar to Immigrants from Eastern Europe by 5th Grade
In terms of 5th grade, the demographic groups most similar to Immigrants from Eastern Europe are Ute (97.4%, a difference of 0.0%), Alsatian (97.4%, a difference of 0.0%), Immigrants from Israel (97.5%, a difference of 0.020%), Hopi (97.5%, a difference of 0.020%), and Immigrants from South Central Asia (97.5%, a difference of 0.020%).
| Demographics | Rating | Rank | 5th Grade |
| Immigrants | Greece | 83.2 /100 | #144 | Excellent 97.5% |
| Jordanians | 82.6 /100 | #145 | Excellent 97.5% |
| Spaniards | 81.9 /100 | #146 | Excellent 97.5% |
| Soviet Union | 81.2 /100 | #147 | Excellent 97.5% |
| Immigrants | Israel | 79.1 /100 | #148 | Good 97.5% |
| Hopi | 78.6 /100 | #149 | Good 97.5% |
| Immigrants | South Central Asia | 78.6 /100 | #150 | Good 97.5% |
| Immigrants | Eastern Europe | 75.0 /100 | #151 | Good 97.4% |
| Ute | 74.9 /100 | #152 | Good 97.4% |
| Alsatians | 74.3 /100 | #153 | Good 97.4% |
| Immigrants | Russia | 71.2 /100 | #154 | Good 97.4% |
| Immigrants | Bosnia and Herzegovina | 71.0 /100 | #155 | Good 97.4% |
| French American Indians | 70.5 /100 | #156 | Good 97.4% |
| Immigrants | Jordan | 70.4 /100 | #157 | Good 97.4% |
| Albanians | 68.3 /100 | #158 | Good 97.4% |