Immigrants from Cuba vs Immigrants from Eastern Europe 5th Grade
COMPARE
Immigrants from Cuba
Immigrants from Eastern Europe
5th Grade
5th Grade Comparison
Immigrants from Cuba
Immigrants from Eastern Europe
96.1%
5TH GRADE
0.0/ 100
METRIC RATING
301st/ 347
METRIC RANK
97.4%
5TH GRADE
75.0/ 100
METRIC RATING
151st/ 347
METRIC RANK
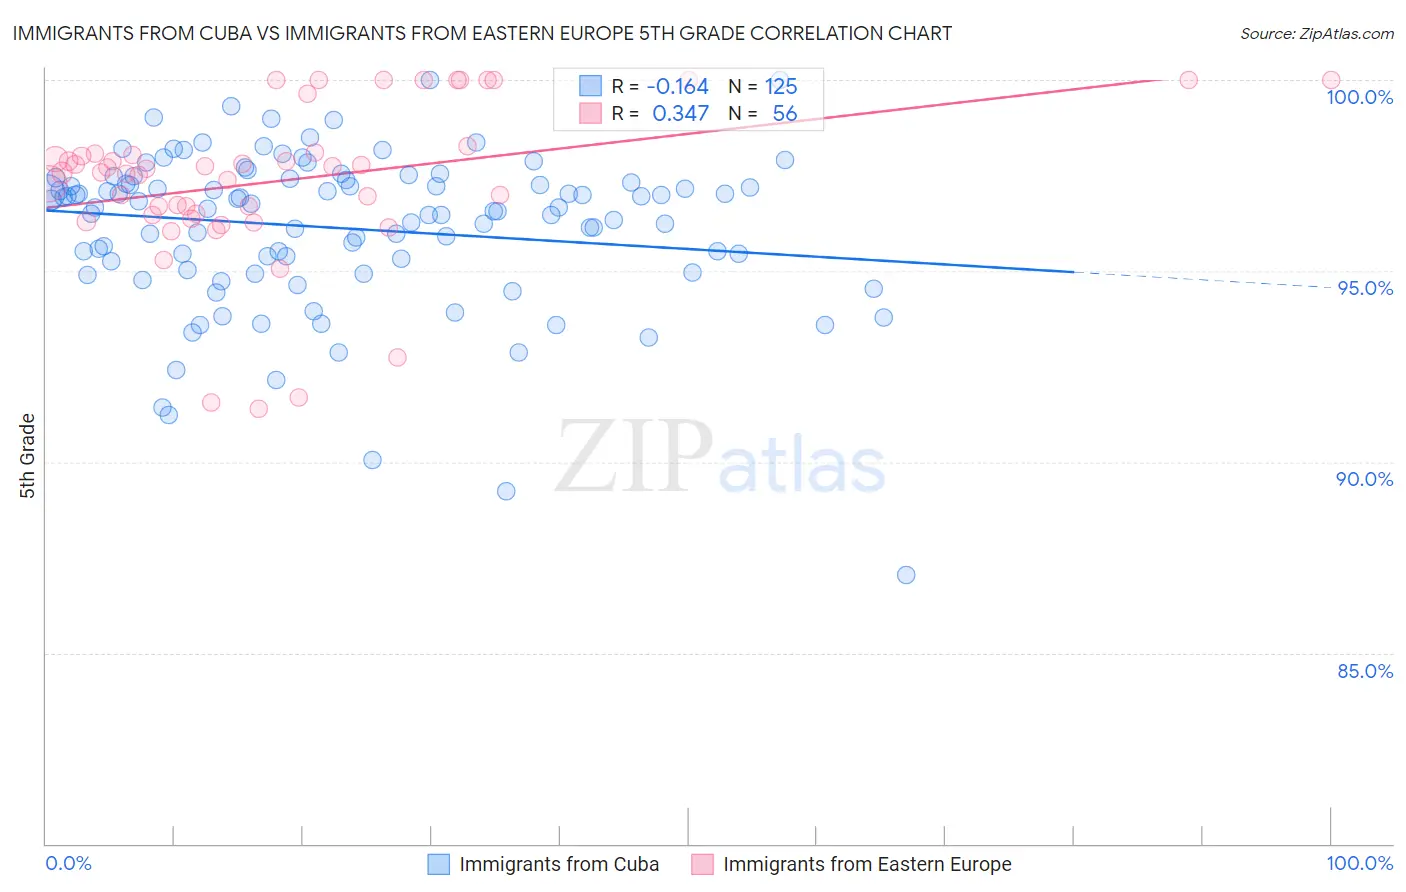
Immigrants from Cuba vs Immigrants from Eastern Europe 5th Grade Correlation Chart
The statistical analysis conducted on geographies consisting of 326,028,159 people shows a poor negative correlation between the proportion of Immigrants from Cuba and percentage of population with at least 5th grade education in the United States with a correlation coefficient (R) of -0.164 and weighted average of 96.1%. Similarly, the statistical analysis conducted on geographies consisting of 475,879,420 people shows a mild positive correlation between the proportion of Immigrants from Eastern Europe and percentage of population with at least 5th grade education in the United States with a correlation coefficient (R) of 0.347 and weighted average of 97.4%, a difference of 1.4%.
5th Grade Correlation Summary
| Measurement | Immigrants from Cuba | Immigrants from Eastern Europe |
| Minimum | 87.0% | 91.4% |
| Maximum | 100.0% | 100.0% |
| Range | 13.0% | 8.6% |
| Mean | 96.1% | 97.4% |
| Median | 96.6% | 97.6% |
| Interquartile 25% (IQ1) | 95.1% | 96.5% |
| Interquartile 75% (IQ3) | 97.3% | 98.1% |
| Interquartile Range (IQR) | 2.2% | 1.6% |
| Standard Deviation (Sample) | 2.1% | 2.1% |
| Standard Deviation (Population) | 2.1% | 2.0% |
Similar Demographics by 5th Grade
Demographics Similar to Immigrants from Cuba by 5th Grade
In terms of 5th grade, the demographic groups most similar to Immigrants from Cuba are Guyanese (96.1%, a difference of 0.010%), Sri Lankan (96.1%, a difference of 0.020%), Puerto Rican (96.1%, a difference of 0.020%), Immigrants from Burma/Myanmar (96.1%, a difference of 0.050%), and Immigrants (96.2%, a difference of 0.070%).
| Demographics | Rating | Rank | 5th Grade |
| Immigrants | Eritrea | 0.0 /100 | #294 | Tragic 96.4% |
| Immigrants | Somalia | 0.0 /100 | #295 | Tragic 96.4% |
| Immigrants | South Eastern Asia | 0.0 /100 | #296 | Tragic 96.3% |
| Haitians | 0.0 /100 | #297 | Tragic 96.3% |
| Immigrants | Dominica | 0.0 /100 | #298 | Tragic 96.2% |
| Immigrants | Immigrants | 0.0 /100 | #299 | Tragic 96.2% |
| Sri Lankans | 0.0 /100 | #300 | Tragic 96.1% |
| Immigrants | Cuba | 0.0 /100 | #301 | Tragic 96.1% |
| Guyanese | 0.0 /100 | #302 | Tragic 96.1% |
| Puerto Ricans | 0.0 /100 | #303 | Tragic 96.1% |
| Immigrants | Burma/Myanmar | 0.0 /100 | #304 | Tragic 96.1% |
| Immigrants | Laos | 0.0 /100 | #305 | Tragic 96.0% |
| Immigrants | Haiti | 0.0 /100 | #306 | Tragic 96.0% |
| Immigrants | Caribbean | 0.0 /100 | #307 | Tragic 96.0% |
| Ecuadorians | 0.0 /100 | #308 | Tragic 96.0% |
Demographics Similar to Immigrants from Eastern Europe by 5th Grade
In terms of 5th grade, the demographic groups most similar to Immigrants from Eastern Europe are Ute (97.4%, a difference of 0.0%), Alsatian (97.4%, a difference of 0.0%), Immigrants from Israel (97.5%, a difference of 0.020%), Hopi (97.5%, a difference of 0.020%), and Immigrants from South Central Asia (97.5%, a difference of 0.020%).
| Demographics | Rating | Rank | 5th Grade |
| Immigrants | Greece | 83.2 /100 | #144 | Excellent 97.5% |
| Jordanians | 82.6 /100 | #145 | Excellent 97.5% |
| Spaniards | 81.9 /100 | #146 | Excellent 97.5% |
| Soviet Union | 81.2 /100 | #147 | Excellent 97.5% |
| Immigrants | Israel | 79.1 /100 | #148 | Good 97.5% |
| Hopi | 78.6 /100 | #149 | Good 97.5% |
| Immigrants | South Central Asia | 78.6 /100 | #150 | Good 97.5% |
| Immigrants | Eastern Europe | 75.0 /100 | #151 | Good 97.4% |
| Ute | 74.9 /100 | #152 | Good 97.4% |
| Alsatians | 74.3 /100 | #153 | Good 97.4% |
| Immigrants | Russia | 71.2 /100 | #154 | Good 97.4% |
| Immigrants | Bosnia and Herzegovina | 71.0 /100 | #155 | Good 97.4% |
| French American Indians | 70.5 /100 | #156 | Good 97.4% |
| Immigrants | Jordan | 70.4 /100 | #157 | Good 97.4% |
| Albanians | 68.3 /100 | #158 | Good 97.4% |