Immigrants from Japan vs Immigrants from Switzerland 2nd Grade
COMPARE
Immigrants from Japan
Immigrants from Switzerland
2nd Grade
2nd Grade Comparison
Immigrants from Japan
Immigrants from Switzerland
98.1%
2ND GRADE
94.1/ 100
METRIC RATING
123rd/ 347
METRIC RANK
98.1%
2ND GRADE
97.3/ 100
METRIC RATING
108th/ 347
METRIC RANK
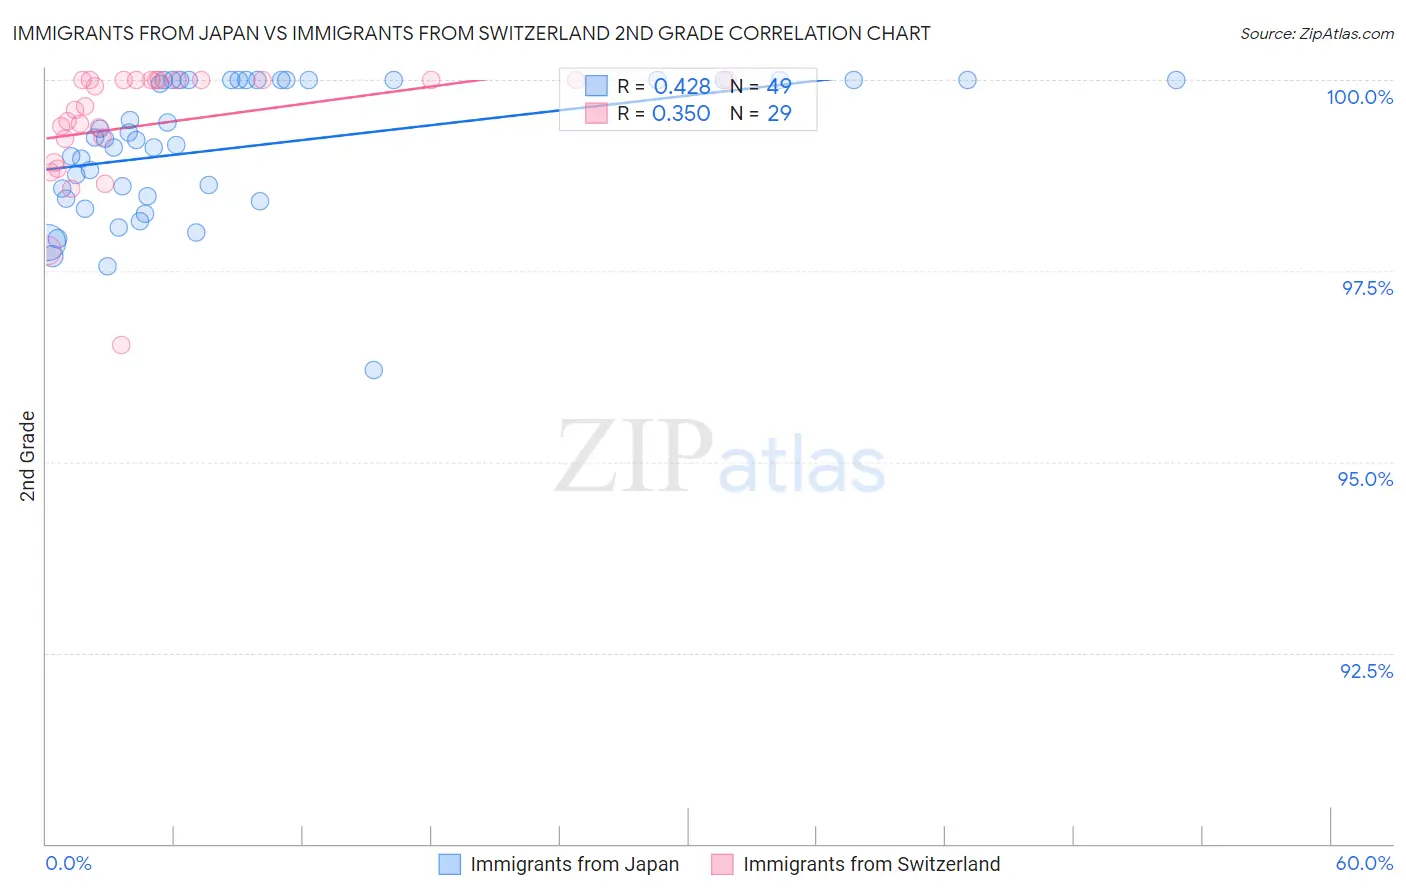
Immigrants from Japan vs Immigrants from Switzerland 2nd Grade Correlation Chart
The statistical analysis conducted on geographies consisting of 340,149,128 people shows a moderate positive correlation between the proportion of Immigrants from Japan and percentage of population with at least 2nd grade education in the United States with a correlation coefficient (R) of 0.428 and weighted average of 98.1%. Similarly, the statistical analysis conducted on geographies consisting of 148,082,451 people shows a mild positive correlation between the proportion of Immigrants from Switzerland and percentage of population with at least 2nd grade education in the United States with a correlation coefficient (R) of 0.350 and weighted average of 98.1%, a difference of 0.060%.
2nd Grade Correlation Summary
| Measurement | Immigrants from Japan | Immigrants from Switzerland |
| Minimum | 96.2% | 96.5% |
| Maximum | 100.0% | 100.0% |
| Range | 3.8% | 3.5% |
| Mean | 99.1% | 99.4% |
| Median | 99.2% | 99.7% |
| Interquartile 25% (IQ1) | 98.5% | 99.1% |
| Interquartile 75% (IQ3) | 100.0% | 100.0% |
| Interquartile Range (IQR) | 1.5% | 0.93% |
| Standard Deviation (Sample) | 0.89% | 0.80% |
| Standard Deviation (Population) | 0.88% | 0.79% |
Demographics Similar to Immigrants from Japan and Immigrants from Switzerland by 2nd Grade
In terms of 2nd grade, the demographic groups most similar to Immigrants from Japan are Immigrants from Zimbabwe (98.1%, a difference of 0.0%), Lebanese (98.1%, a difference of 0.0%), Menominee (98.1%, a difference of 0.0%), Iroquois (98.1%, a difference of 0.0%), and Okinawan (98.1%, a difference of 0.010%). Similarly, the demographic groups most similar to Immigrants from Switzerland are Bhutanese (98.1%, a difference of 0.0%), German Russian (98.1%, a difference of 0.0%), Basque (98.1%, a difference of 0.0%), Yugoslavian (98.2%, a difference of 0.010%), and Immigrants from Singapore (98.1%, a difference of 0.010%).
| Demographics | Rating | Rank | 2nd Grade |
| Yugoslavians | 97.5 /100 | #105 | Exceptional 98.2% |
| Bhutanese | 97.5 /100 | #106 | Exceptional 98.1% |
| German Russians | 97.4 /100 | #107 | Exceptional 98.1% |
| Immigrants | Switzerland | 97.3 /100 | #108 | Exceptional 98.1% |
| Basques | 97.2 /100 | #109 | Exceptional 98.1% |
| Immigrants | Singapore | 97.0 /100 | #110 | Exceptional 98.1% |
| Immigrants | Czechoslovakia | 96.9 /100 | #111 | Exceptional 98.1% |
| Colville | 96.6 /100 | #112 | Exceptional 98.1% |
| Immigrants | Norway | 96.5 /100 | #113 | Exceptional 98.1% |
| Immigrants | Latvia | 96.4 /100 | #114 | Exceptional 98.1% |
| Iranians | 95.9 /100 | #115 | Exceptional 98.1% |
| Spanish | 95.8 /100 | #116 | Exceptional 98.1% |
| Ute | 95.7 /100 | #117 | Exceptional 98.1% |
| Immigrants | France | 95.6 /100 | #118 | Exceptional 98.1% |
| Thais | 95.3 /100 | #119 | Exceptional 98.1% |
| Okinawans | 94.9 /100 | #120 | Exceptional 98.1% |
| Immigrants | Zimbabwe | 94.4 /100 | #121 | Exceptional 98.1% |
| Lebanese | 94.2 /100 | #122 | Exceptional 98.1% |
| Immigrants | Japan | 94.1 /100 | #123 | Exceptional 98.1% |
| Menominee | 94.1 /100 | #124 | Exceptional 98.1% |
| Iroquois | 94.1 /100 | #125 | Exceptional 98.1% |