Japanese vs Immigrants from Switzerland Female Poverty Among 18-24 Year Olds
COMPARE
Japanese
Immigrants from Switzerland
Female Poverty Among 18-24 Year Olds
Female Poverty Among 18-24 Year Olds Comparison
Japanese
Immigrants from Switzerland
18.8%
FEMALE POVERTY AMONG 18-24 YEAR OLDS
99.5/ 100
METRIC RATING
81st/ 347
METRIC RANK
21.8%
FEMALE POVERTY AMONG 18-24 YEAR OLDS
0.1/ 100
METRIC RATING
277th/ 347
METRIC RANK
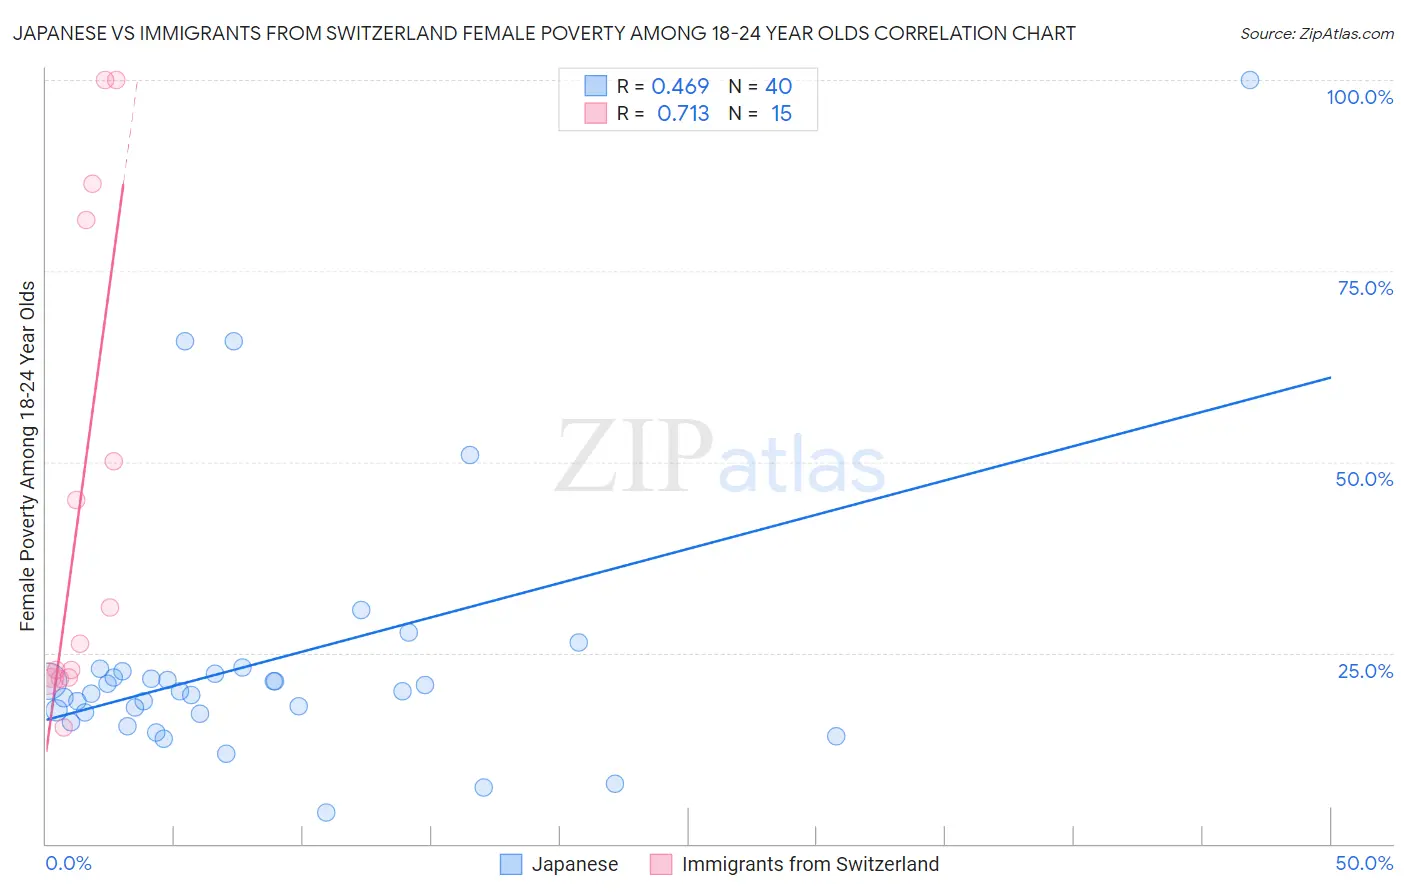
Japanese vs Immigrants from Switzerland Female Poverty Among 18-24 Year Olds Correlation Chart
The statistical analysis conducted on geographies consisting of 246,409,526 people shows a moderate positive correlation between the proportion of Japanese and poverty level among females between the ages 18 and 24 in the United States with a correlation coefficient (R) of 0.469 and weighted average of 18.8%. Similarly, the statistical analysis conducted on geographies consisting of 145,929,420 people shows a strong positive correlation between the proportion of Immigrants from Switzerland and poverty level among females between the ages 18 and 24 in the United States with a correlation coefficient (R) of 0.713 and weighted average of 21.8%, a difference of 16.0%.
Female Poverty Among 18-24 Year Olds Correlation Summary
| Measurement | Japanese | Immigrants from Switzerland |
| Minimum | 4.1% | 15.3% |
| Maximum | 100.0% | 100.0% |
| Range | 95.9% | 84.7% |
| Mean | 23.9% | 44.5% |
| Median | 20.0% | 26.2% |
| Interquartile 25% (IQ1) | 17.1% | 21.7% |
| Interquartile 75% (IQ3) | 22.4% | 81.7% |
| Interquartile Range (IQR) | 5.3% | 59.9% |
| Standard Deviation (Sample) | 17.5% | 31.3% |
| Standard Deviation (Population) | 17.3% | 30.3% |
Similar Demographics by Female Poverty Among 18-24 Year Olds
Demographics Similar to Japanese by Female Poverty Among 18-24 Year Olds
In terms of female poverty among 18-24 year olds, the demographic groups most similar to Japanese are Palestinian (18.8%, a difference of 0.0%), Immigrants from Europe (18.8%, a difference of 0.080%), Uruguayan (18.8%, a difference of 0.080%), Costa Rican (18.8%, a difference of 0.090%), and Immigrants from Uruguay (18.8%, a difference of 0.11%).
| Demographics | Rating | Rank | Female Poverty Among 18-24 Year Olds |
| Hawaiians | 99.6 /100 | #74 | Exceptional 18.7% |
| Poles | 99.6 /100 | #75 | Exceptional 18.8% |
| Immigrants | Cambodia | 99.5 /100 | #76 | Exceptional 18.8% |
| Costa Ricans | 99.5 /100 | #77 | Exceptional 18.8% |
| Immigrants | Europe | 99.5 /100 | #78 | Exceptional 18.8% |
| Uruguayans | 99.5 /100 | #79 | Exceptional 18.8% |
| Palestinians | 99.5 /100 | #80 | Exceptional 18.8% |
| Japanese | 99.5 /100 | #81 | Exceptional 18.8% |
| Immigrants | Uruguay | 99.4 /100 | #82 | Exceptional 18.8% |
| Immigrants | Indonesia | 99.4 /100 | #83 | Exceptional 18.9% |
| Burmese | 99.2 /100 | #84 | Exceptional 18.9% |
| Immigrants | Armenia | 99.2 /100 | #85 | Exceptional 18.9% |
| Immigrants | Iraq | 99.2 /100 | #86 | Exceptional 18.9% |
| Immigrants | Jamaica | 99.2 /100 | #87 | Exceptional 18.9% |
| Croatians | 99.1 /100 | #88 | Exceptional 19.0% |
Demographics Similar to Immigrants from Switzerland by Female Poverty Among 18-24 Year Olds
In terms of female poverty among 18-24 year olds, the demographic groups most similar to Immigrants from Switzerland are Bahamian (21.8%, a difference of 0.13%), Immigrants from Bangladesh (21.8%, a difference of 0.15%), Immigrants from Honduras (21.8%, a difference of 0.19%), Yaqui (21.9%, a difference of 0.26%), and Spanish American (21.9%, a difference of 0.43%).
| Demographics | Rating | Rank | Female Poverty Among 18-24 Year Olds |
| Mongolians | 0.2 /100 | #270 | Tragic 21.6% |
| Scotch-Irish | 0.2 /100 | #271 | Tragic 21.6% |
| Basques | 0.2 /100 | #272 | Tragic 21.7% |
| New Zealanders | 0.2 /100 | #273 | Tragic 21.7% |
| Immigrants | Honduras | 0.1 /100 | #274 | Tragic 21.8% |
| Immigrants | Bangladesh | 0.1 /100 | #275 | Tragic 21.8% |
| Bahamians | 0.1 /100 | #276 | Tragic 21.8% |
| Immigrants | Switzerland | 0.1 /100 | #277 | Tragic 21.8% |
| Yaqui | 0.1 /100 | #278 | Tragic 21.9% |
| Spanish Americans | 0.1 /100 | #279 | Tragic 21.9% |
| Immigrants | Dominica | 0.1 /100 | #280 | Tragic 21.9% |
| Immigrants | Dominican Republic | 0.1 /100 | #281 | Tragic 21.9% |
| Bermudans | 0.1 /100 | #282 | Tragic 21.9% |
| Sub-Saharan Africans | 0.0 /100 | #283 | Tragic 22.0% |
| Tlingit-Haida | 0.0 /100 | #284 | Tragic 22.0% |