Immigrants from Liberia vs Scotch-Irish Bachelor's Degree
COMPARE
Immigrants from Liberia
Scotch-Irish
Bachelor's Degree
Bachelor's Degree Comparison
Immigrants from Liberia
Scotch-Irish
33.5%
BACHELOR'S DEGREE
0.9/ 100
METRIC RATING
249th/ 347
METRIC RANK
36.4%
BACHELOR'S DEGREE
18.3/ 100
METRIC RATING
211th/ 347
METRIC RANK
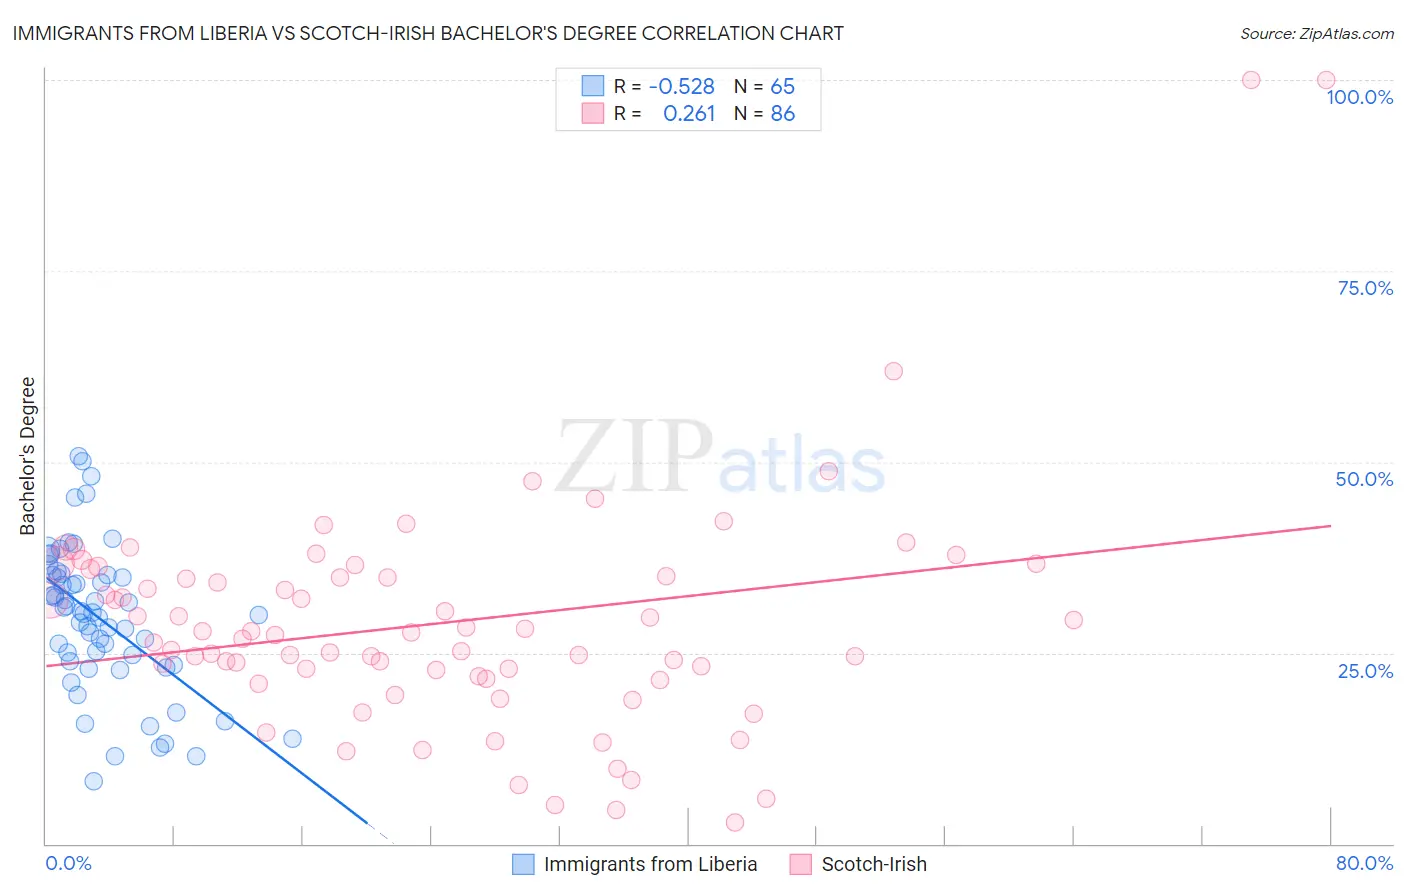
Immigrants from Liberia vs Scotch-Irish Bachelor's Degree Correlation Chart
The statistical analysis conducted on geographies consisting of 135,292,805 people shows a substantial negative correlation between the proportion of Immigrants from Liberia and percentage of population with at least bachelor's degree education in the United States with a correlation coefficient (R) of -0.528 and weighted average of 33.5%. Similarly, the statistical analysis conducted on geographies consisting of 548,685,901 people shows a weak positive correlation between the proportion of Scotch-Irish and percentage of population with at least bachelor's degree education in the United States with a correlation coefficient (R) of 0.261 and weighted average of 36.4%, a difference of 8.7%.
Bachelor's Degree Correlation Summary
| Measurement | Immigrants from Liberia | Scotch-Irish |
| Minimum | 8.2% | 2.9% |
| Maximum | 50.7% | 100.0% |
| Range | 42.4% | 97.1% |
| Mean | 29.4% | 28.9% |
| Median | 30.3% | 27.5% |
| Interquartile 25% (IQ1) | 23.6% | 21.9% |
| Interquartile 75% (IQ3) | 35.1% | 35.1% |
| Interquartile Range (IQR) | 11.5% | 13.2% |
| Standard Deviation (Sample) | 9.5% | 15.4% |
| Standard Deviation (Population) | 9.5% | 15.3% |
Similar Demographics by Bachelor's Degree
Demographics Similar to Immigrants from Liberia by Bachelor's Degree
In terms of bachelor's degree, the demographic groups most similar to Immigrants from Liberia are Indonesian (33.5%, a difference of 0.010%), Cree (33.6%, a difference of 0.13%), Immigrants from Congo (33.6%, a difference of 0.14%), Jamaican (33.6%, a difference of 0.23%), and Immigrants from Fiji (33.7%, a difference of 0.59%).
| Demographics | Rating | Rank | Bachelor's Degree |
| Immigrants | Nonimmigrants | 1.8 /100 | #242 | Tragic 34.2% |
| Immigrants | Guyana | 1.4 /100 | #243 | Tragic 33.9% |
| Delaware | 1.2 /100 | #244 | Tragic 33.8% |
| Immigrants | Fiji | 1.2 /100 | #245 | Tragic 33.7% |
| Jamaicans | 1.0 /100 | #246 | Tragic 33.6% |
| Immigrants | Congo | 1.0 /100 | #247 | Tragic 33.6% |
| Cree | 1.0 /100 | #248 | Tragic 33.6% |
| Immigrants | Liberia | 0.9 /100 | #249 | Tragic 33.5% |
| Indonesians | 0.9 /100 | #250 | Tragic 33.5% |
| Japanese | 0.7 /100 | #251 | Tragic 33.3% |
| Immigrants | Bahamas | 0.7 /100 | #252 | Tragic 33.3% |
| U.S. Virgin Islanders | 0.7 /100 | #253 | Tragic 33.2% |
| Native Hawaiians | 0.7 /100 | #254 | Tragic 33.2% |
| Iroquois | 0.7 /100 | #255 | Tragic 33.2% |
| Nicaraguans | 0.6 /100 | #256 | Tragic 33.1% |
Demographics Similar to Scotch-Irish by Bachelor's Degree
In terms of bachelor's degree, the demographic groups most similar to Scotch-Irish are French (36.5%, a difference of 0.050%), Panamanian (36.5%, a difference of 0.080%), Immigrants from Philippines (36.4%, a difference of 0.080%), Immigrants from Thailand (36.5%, a difference of 0.18%), and Immigrants from Middle Africa (36.6%, a difference of 0.38%).
| Demographics | Rating | Rank | Bachelor's Degree |
| Immigrants | Immigrants | 22.8 /100 | #204 | Fair 36.7% |
| Finns | 22.2 /100 | #205 | Fair 36.7% |
| Spaniards | 21.2 /100 | #206 | Fair 36.6% |
| Immigrants | Middle Africa | 20.6 /100 | #207 | Fair 36.6% |
| Immigrants | Thailand | 19.4 /100 | #208 | Poor 36.5% |
| Panamanians | 18.8 /100 | #209 | Poor 36.5% |
| French | 18.6 /100 | #210 | Poor 36.5% |
| Scotch-Irish | 18.3 /100 | #211 | Poor 36.4% |
| Immigrants | Philippines | 17.8 /100 | #212 | Poor 36.4% |
| Immigrants | Panama | 14.2 /100 | #213 | Poor 36.2% |
| Germans | 13.9 /100 | #214 | Poor 36.1% |
| Immigrants | Western Africa | 13.8 /100 | #215 | Poor 36.1% |
| Barbadians | 13.5 /100 | #216 | Poor 36.1% |
| German Russians | 10.2 /100 | #217 | Poor 35.8% |
| Sub-Saharan Africans | 9.8 /100 | #218 | Tragic 35.8% |