Israeli vs Zimbabwean College, 1 year or more
COMPARE
Israeli
Zimbabwean
College, 1 year or more
College, 1 year or more Comparison
Israelis
Zimbabweans
65.3%
COLLEGE, 1 YEAR OR MORE
99.9/ 100
METRIC RATING
34th/ 347
METRIC RANK
64.2%
COLLEGE, 1 YEAR OR MORE
99.8/ 100
METRIC RATING
54th/ 347
METRIC RANK
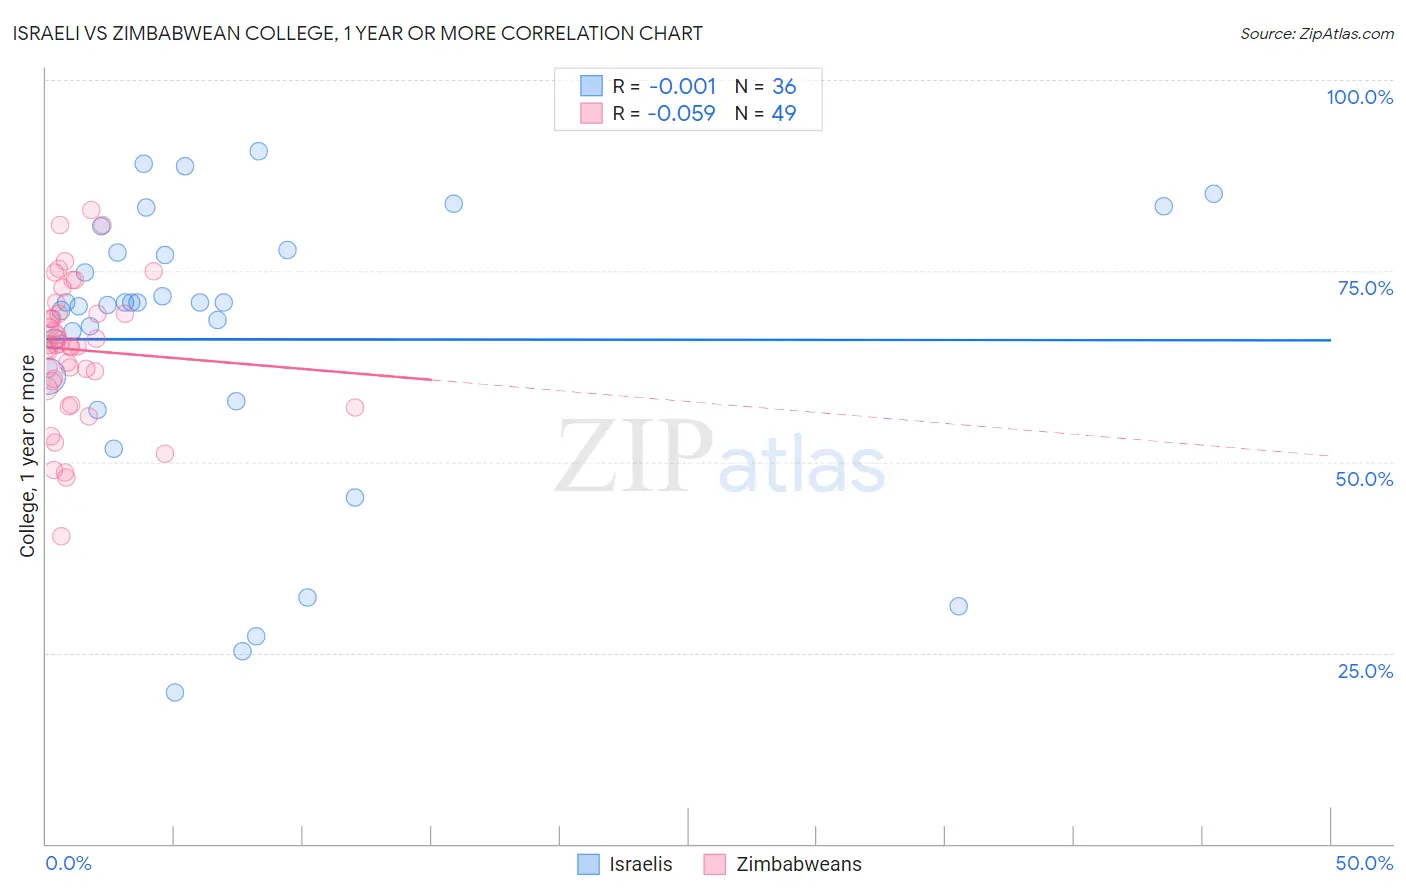
Israeli vs Zimbabwean College, 1 year or more Correlation Chart
The statistical analysis conducted on geographies consisting of 211,218,479 people shows no correlation between the proportion of Israelis and percentage of population with at least college, 1 year or more education in the United States with a correlation coefficient (R) of -0.001 and weighted average of 65.3%. Similarly, the statistical analysis conducted on geographies consisting of 69,202,005 people shows a slight negative correlation between the proportion of Zimbabweans and percentage of population with at least college, 1 year or more education in the United States with a correlation coefficient (R) of -0.059 and weighted average of 64.2%, a difference of 1.8%.
College, 1 year or more Correlation Summary
| Measurement | Israeli | Zimbabwean |
| Minimum | 19.8% | 40.2% |
| Maximum | 90.6% | 83.0% |
| Range | 70.9% | 42.8% |
| Mean | 66.0% | 64.7% |
| Median | 70.8% | 65.2% |
| Interquartile 25% (IQ1) | 59.5% | 60.1% |
| Interquartile 75% (IQ3) | 77.6% | 69.5% |
| Interquartile Range (IQR) | 18.0% | 9.4% |
| Standard Deviation (Sample) | 18.8% | 9.0% |
| Standard Deviation (Population) | 18.5% | 8.9% |
Demographics Similar to Israelis and Zimbabweans by College, 1 year or more
In terms of college, 1 year or more, the demographic groups most similar to Israelis are Immigrants from Turkey (65.2%, a difference of 0.20%), Immigrants from South Africa (65.1%, a difference of 0.28%), Russian (65.1%, a difference of 0.28%), Immigrants from Saudi Arabia (65.0%, a difference of 0.43%), and Estonian (65.0%, a difference of 0.51%). Similarly, the demographic groups most similar to Zimbabweans are Asian (64.2%, a difference of 0.030%), Immigrants from Netherlands (64.2%, a difference of 0.050%), Immigrants from Malaysia (64.3%, a difference of 0.21%), Immigrants from Austria (64.4%, a difference of 0.29%), and New Zealander (64.6%, a difference of 0.58%).
| Demographics | Rating | Rank | College, 1 year or more |
| Israelis | 99.9 /100 | #34 | Exceptional 65.3% |
| Immigrants | Turkey | 99.9 /100 | #35 | Exceptional 65.2% |
| Immigrants | South Africa | 99.9 /100 | #36 | Exceptional 65.1% |
| Russians | 99.9 /100 | #37 | Exceptional 65.1% |
| Immigrants | Saudi Arabia | 99.9 /100 | #38 | Exceptional 65.0% |
| Estonians | 99.9 /100 | #39 | Exceptional 65.0% |
| Immigrants | Kuwait | 99.9 /100 | #40 | Exceptional 65.0% |
| Mongolians | 99.9 /100 | #41 | Exceptional 64.8% |
| Immigrants | Latvia | 99.9 /100 | #42 | Exceptional 64.8% |
| Immigrants | Russia | 99.9 /100 | #43 | Exceptional 64.7% |
| Immigrants | Norway | 99.9 /100 | #44 | Exceptional 64.7% |
| Immigrants | Lithuania | 99.9 /100 | #45 | Exceptional 64.6% |
| Bhutanese | 99.9 /100 | #46 | Exceptional 64.6% |
| Australians | 99.9 /100 | #47 | Exceptional 64.6% |
| Immigrants | Bulgaria | 99.9 /100 | #48 | Exceptional 64.6% |
| New Zealanders | 99.9 /100 | #49 | Exceptional 64.6% |
| Immigrants | Austria | 99.8 /100 | #50 | Exceptional 64.4% |
| Immigrants | Malaysia | 99.8 /100 | #51 | Exceptional 64.3% |
| Immigrants | Netherlands | 99.8 /100 | #52 | Exceptional 64.2% |
| Asians | 99.8 /100 | #53 | Exceptional 64.2% |
| Zimbabweans | 99.8 /100 | #54 | Exceptional 64.2% |